Debugging JavaScript with Conditional Breakpoints
Last updated 17 minutes ago
Learn how to debug JavaScrip
 What you will learn
- Know some thricks for JavaScript debugging
 Prerequisites
- A CoreMedia development system
 Target Audience
This guide is for Developers.
Table of Contents
Many developers know browser developer tools. The Chrome Developer Tools are the most mentioned ones as they provide a rich set of features.
In the developer tools you can add, for example, breakpoints to your JavaScript code. But if you are debugging a frequently called method, you will be most likely annoyed by clicking Continue again and again.
You can do much better in these cases with a trick using conditional breakpoints and console.log() as your condition.
But let us start with adding such a conditional breakpoint. This article assumes that you use Chrome Developer Tools, but you can use the trick in other browsers as well.
Conditional Breakpoints
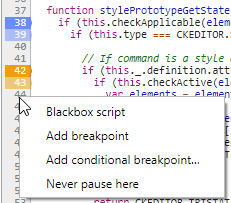
Having opened a JavaScript file (for example, via Ctrl+P and typing a part of the name), you can add breakpoints by clicking on the line column and for enhanced features you can right click it:
Figure 1. Adding breakpoints in Chrome Developer Tools
For conditional breakpoints you can add expressions which, if they evaluate to true, will cause the debugger to stop:
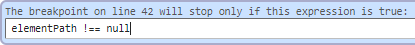
Figure 2. Adding condition to breakpoint
Breakpoint Debug Logging
Knowing conditional breakpoints and knowing the concept of https://xxx[falsy values in JavaScript], the next step is simple:
Instead of having a normal expression just add something like console.log("Hello World!") as your breakpoint expression. As console.log returns undefined the debugger won’t stop here but just log to the console.
Logging Debug Values
If using this logging approach you most likely want to output values. While you just might add them with "+" it is better to separate these values with comma:
console.log("This is myObject:", myObject)This results in an output like this (by default the object node is collapsed):
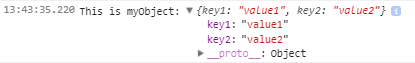
Figure 3. Result console log output
Attention with Object References
The small "i" in the screenshot above will tell you about a problem of this approach: The value you see in the console is the current value and not necessarily the value when the log entry was triggered. This is because it is only an object reference.
So you need a way to resolve these references, if it is important to observe the development of an object. You can either access the values directly in your log statement or you can use helper methods. Here are some possible approaches:
JSON.stringify
Provides a quick and easy way to transform your object into a nice string representation:
console.log("This is myObject:", JSON.stringify(myObject))Caveats: JSON.stringify might fail silently even preventing logging, if the object contains self-references. And, of course, you lose the ability to expand and collapse object nodes. The latter one you might work around by using JSON.parse(JSON.stringify(myObject)).
Object.assign
Another way to get a copy of your object is to use Object.assign:
console.log("This is myObject:", Object.assign({}, myObject))Advantage: You can expand and collapse the tree. Caveat: It is only a shallow copy of your object.
Object Existence with !!
Sometimes it is enough just to see if an object actually exists:
console.log("Exists myObject?", !!myObject)Advantage: Quick. Caveat: Not much information of course.
See also
For more information and much more debugging tricks see the following links:
Is this page useful?