The CAE Developer Toolbox is a web based set of tools that can help developers when working with CAE web applications. It connects to a CAE's remote (or local) MBean server, gathers and aggregates data and provides this via a user interface. The toolbox comes in two flavors: As a CoreMedia Studio plugin and as a standalone variant that can be integrated into any CAE web application.
The Toolbox GUI uses Studio UI components and therefore provides the same user experience. For example, detailed information is displayed in tooltips, columns can be added, removed or sorted. The Toolbox contains two tabs, Cache Statistics and Cache Browser.
Cache Statistics
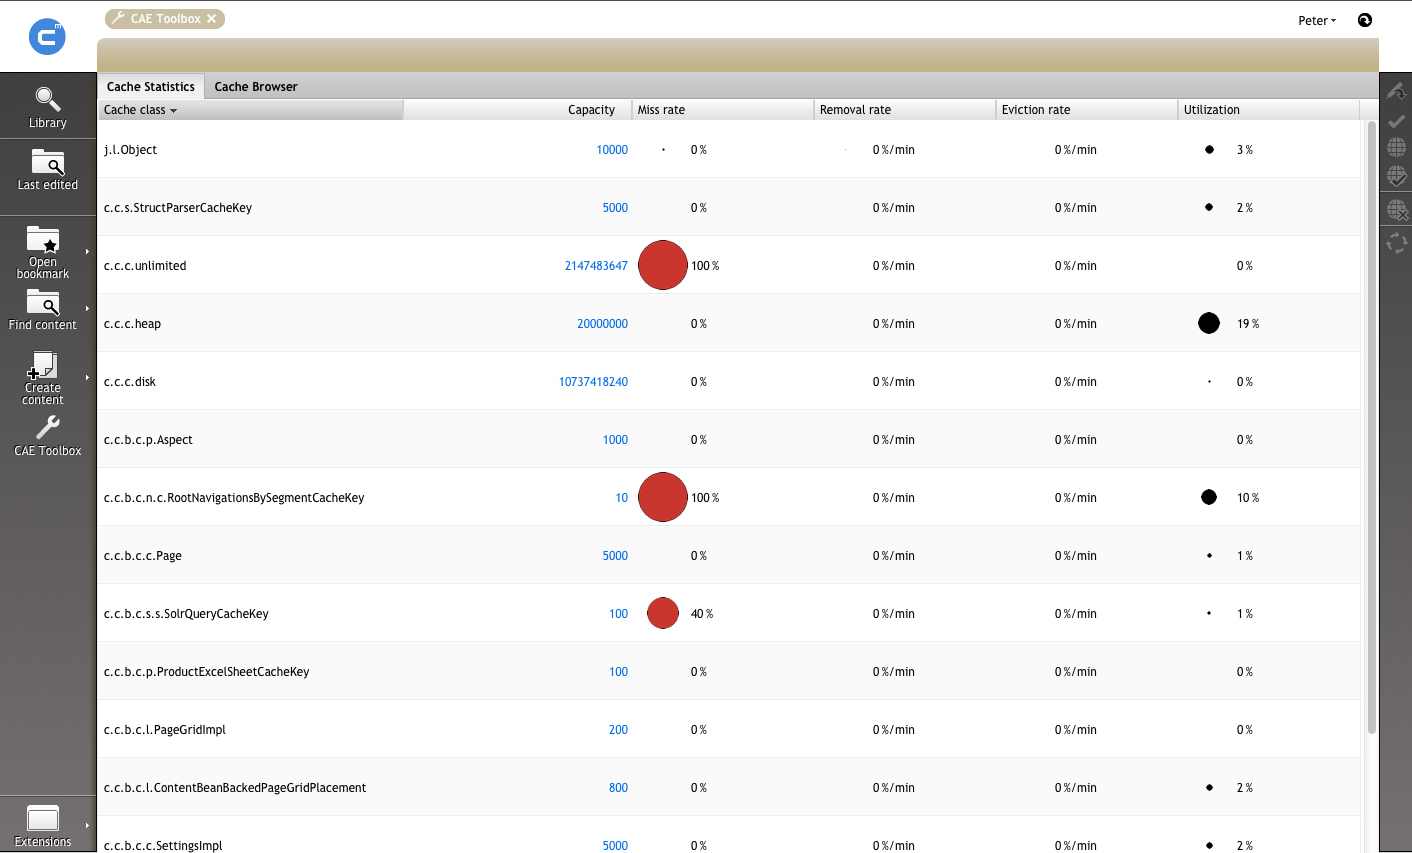
Cache Statistics provides an overview of the current state of the memory cache.
There are several measurements that report the current state and behavior of the cache keys. For instance, the cache utilization and the hit rate is displayed. Displayed values are reloaded periodically. If the CAE monitored by the tool serves requests while the Toolbox is open, a developer can watch the memory cache utilization in order to determine if the application works correctly.
Cache Browser
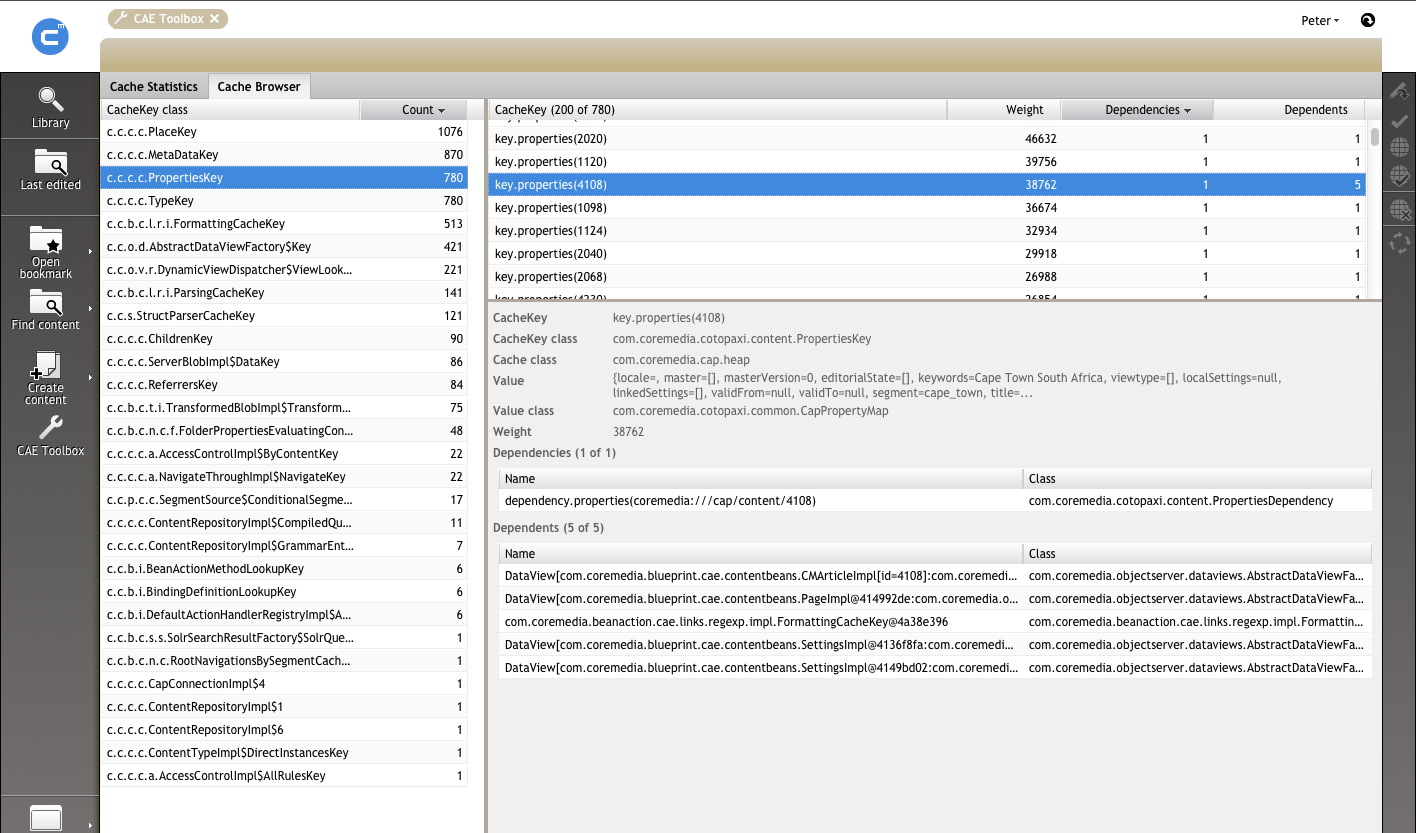
A tool for browsing through the memory cache.
Starting with list of all cache key classes currently present in the memory cache, you can look
into single cache entries and analyze the cached contents as well as the dependencies and
dependents. The view is split up into three areas, a list of all
CacheKeys on the left, a list of instances of a particular
CacheKey class (if selected in the list of
all CacheKeys) in the upper right and the detailed view of one
CacheKey (if selected in the list of CacheKeys in the upper right) in the
lower right portion of the screen. Values displayed in the three areas are not reloaded
automatically so that you can spend more time looking at a snapshot of the memory cache. If one
of the areas is reloaded (or loaded for the first time), the contents are requested new from the
memory cache, so value counts may vary. All content can be reloaded by clicking the reload
button in the upper right corner.
Installation
This section describes the two ways the Toolbox can be installed.
Studio Web Application Plugin
Follow these installation steps to run the Toolbox as a plugin within a Studio web application:
Add this dependency to your Studio web application
<dependency>
  <groupId>com.coremedia.cae</groupId>
  <artifactId>cae-toolbox-studio-component</artifactId>
  <scope>runtime</scope>
</dependency>
Configure the JMX URL of the CAE web application to be connected to. Add a property
toolbox.jmx.url=service:jmx:the-jmx-urlto the application, toWEB-INF/application.properties, for instance. If your JMX connector is password protected, you will also need to configure the propertiestoolbox.jmx.userandtoolbox.jmx.password.
After login to CoreMedia Studio with administrator privileges, there is a new button "CAE Toolbox" available in the Favorites Bar that opens the toolbox.
CAE web application Integration
In order to run the Toolbox within a CAE web application (without the need of a running Studio web application) you simply need to add this dependency to your CAE web application.
<dependency>
  <groupId>com.coremedia.cae</groupId>
  <artifactId>cae-toolbox-component</artifactId>
  <scope>runtime</scope>
</dependency>
After starting the CAE web application, the Toolbox connects to the local MBean server which is available at:
http://<host>:<port>/<context>/<servlet>/toolbox (for example http://localhost:8001/webappname/servlet/toolbox)
Working with the Toolbox
The following two examples show how the Toolbox can be used.
Example: How to find cache capacity problems
Problem:
When the capacity configured for a cache class is too low relative to the working set, then even frequently used cache entries will be evicted (high eviction rate). This will also result in a high cache miss rate, as frequently used values do not remain in the cache for very long.
If the cache key evaluation is sufficiently "expensive", this inefficient use of the cache may result in a poor performance.
Finding the cause:
In the Cache Statistics tool check the utilization for all entries.
An entry that has a red circle (means a utilization >= 90%) needs to be observed in more detail. Note that a high utilization isn't a problem per se.
Check the eviction rate of the suspicious entry: If it has a high value (> 20%) over a longer period then you should consider increasing the capacity. A value of 20% for "Eviction rate" means that roughly 20% of the values (measured by their weight, not by their number) are removed per minute.
Increasing the capacity can be easily done by double-clicking into the capacity field and enter the new value. Note that this change is not made persistent: After a restart, the old value will be used.
You can copy the fully qualified cache class name into the system clipboard for further examination in other tools like IDEs, say. Simply select the corresponding row and press CTRL-C.
Example: How to find cache entries with many dependents
Problem:
A cache entry (such as a cached piece of content) having many dependents (such as many data views) can cause a high invalidation rate that requires lots of potentially expensive evaluations.
This might happen when this cache entry is invalidated frequently and thus triggers transitive invalidation of its dependents.
Finding the cause:
In the Cache Statistics tool check the "Removal Rate". An entry having a high value (> 10%) over a longer period should be analyzed, because this is a sign for continuous invalidation activity. If those cache entries are continuously evaluated to insert them into the cache again, you will also see a relatively high "Miss Rate" (number of cache misses divided by lookups) and "Insertion Rate" (approx. amount of cache values computed and inserted into the cache, relative to the capacity, per minute).
Switch to the Cache Browser and click the "Dependents" tab in the upper right corner so that this area's entries are sorted by highest "dependents" values.
Walk through all entries in column "Cache key class" (left area) and check the "Dependents" column (upper right area) for high values.
Cache entries with large numbers of dependents are potential candidates for optimization.


