Website KPIs Configuration
Last updated 17 minutes ago
Example showing the configuration of the website KPIs widget.
The Main KPIs widget gives you flexible ways to analyze your site traffic.
-
Start with a general overview to spot trends.
-
Apply one or two drill-down options to explore details.
-
Compare results across metrics to identify patterns.
This helps you move quickly from high-level data to concrete insights you can use in your daily work. Once you have added the first Website KPIs widget to the Dashboard, you can familiarize yourself with the default settings.
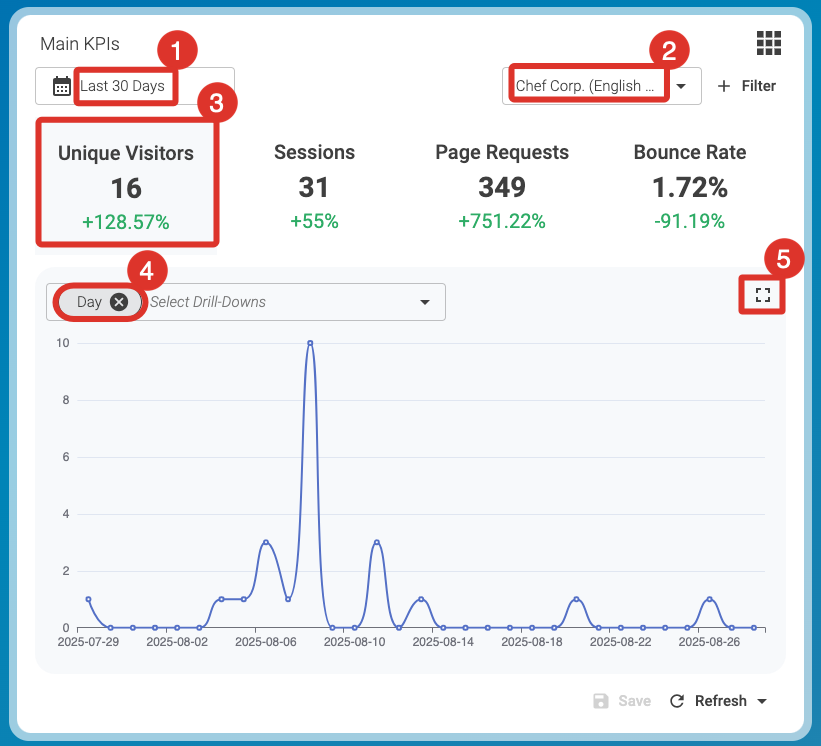
Set filters as follows:
-
Last 30 Days (1)
-
Your Preferred Site (2)
-
Page Requests (3) (Here, the currently selected filter is slightly highlighted.)
-
Day (4)
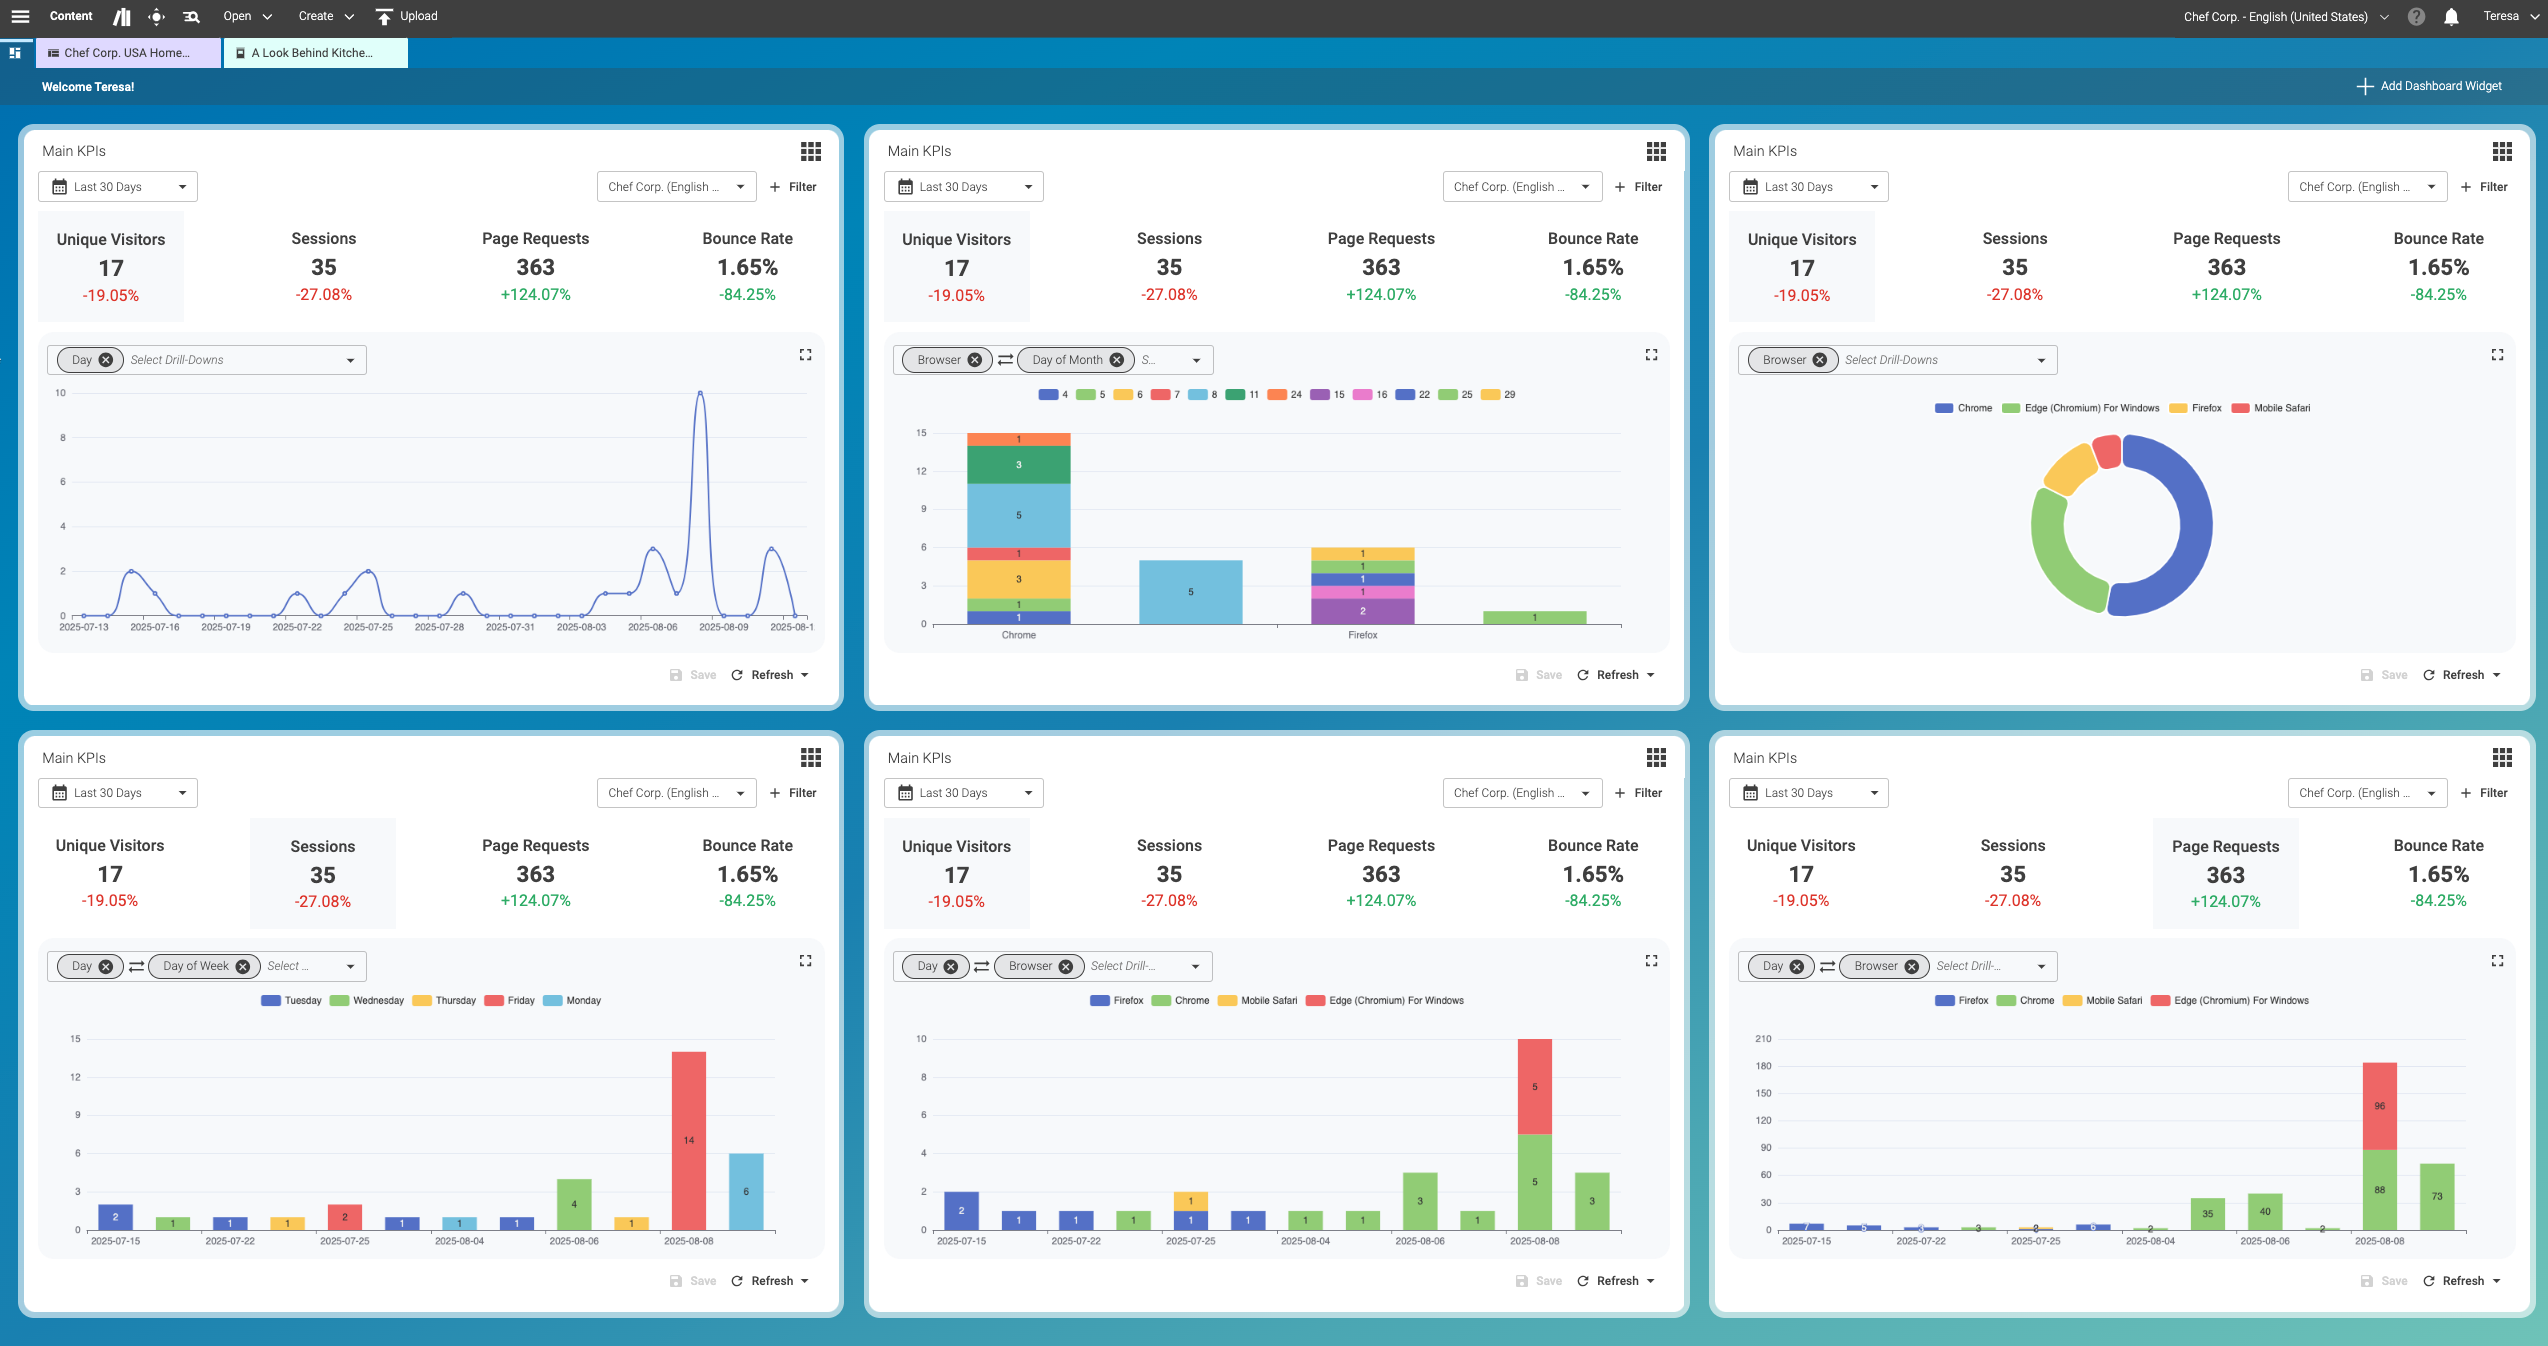
Narrow your focus by selecting specific filters or combining drill-downs. This allows you to explore visitor data from different angles.
The Dashboard in Content Studio lets you combine two parameters from the drill-down menu to group your data. This gives you a more detailed breakdown of your data.
The example below shows several examples of the Website KPIs widget:
Is this page useful?