Configuring the Website KPIs Widget
Learn how to configure the Website KPIs widget to filter, aggregate, and change metrics.
Prerequisites
Before you start:
-
Add a Website KPIs widget to the dashboard.
Steps
1. Filter data
-
Click + Filter in the top-right corner of the Website KPIs widget.
-
Select at least one filter from the dropdown menu:
-
Segments: View data by visitor segments.
-
Country: View data by visitor location. For example:
Portugal,Spain, orGermany. -
Device: View data by device type. For example:
Desktop,Tablet, orMobile.
-
-
After you select a filter, a second dropdown menu appears next to + Filter. For example, select Country, then select Germany from the list of countries.

2. Aggregate data
-
Click the Drill-downs dropdown menu below the metrics.
-
Select at least one drill-down. For example, select Day of Week and Browser.
-
Click 💾 Save in the bottom-right corner of the Website KPIs widget.
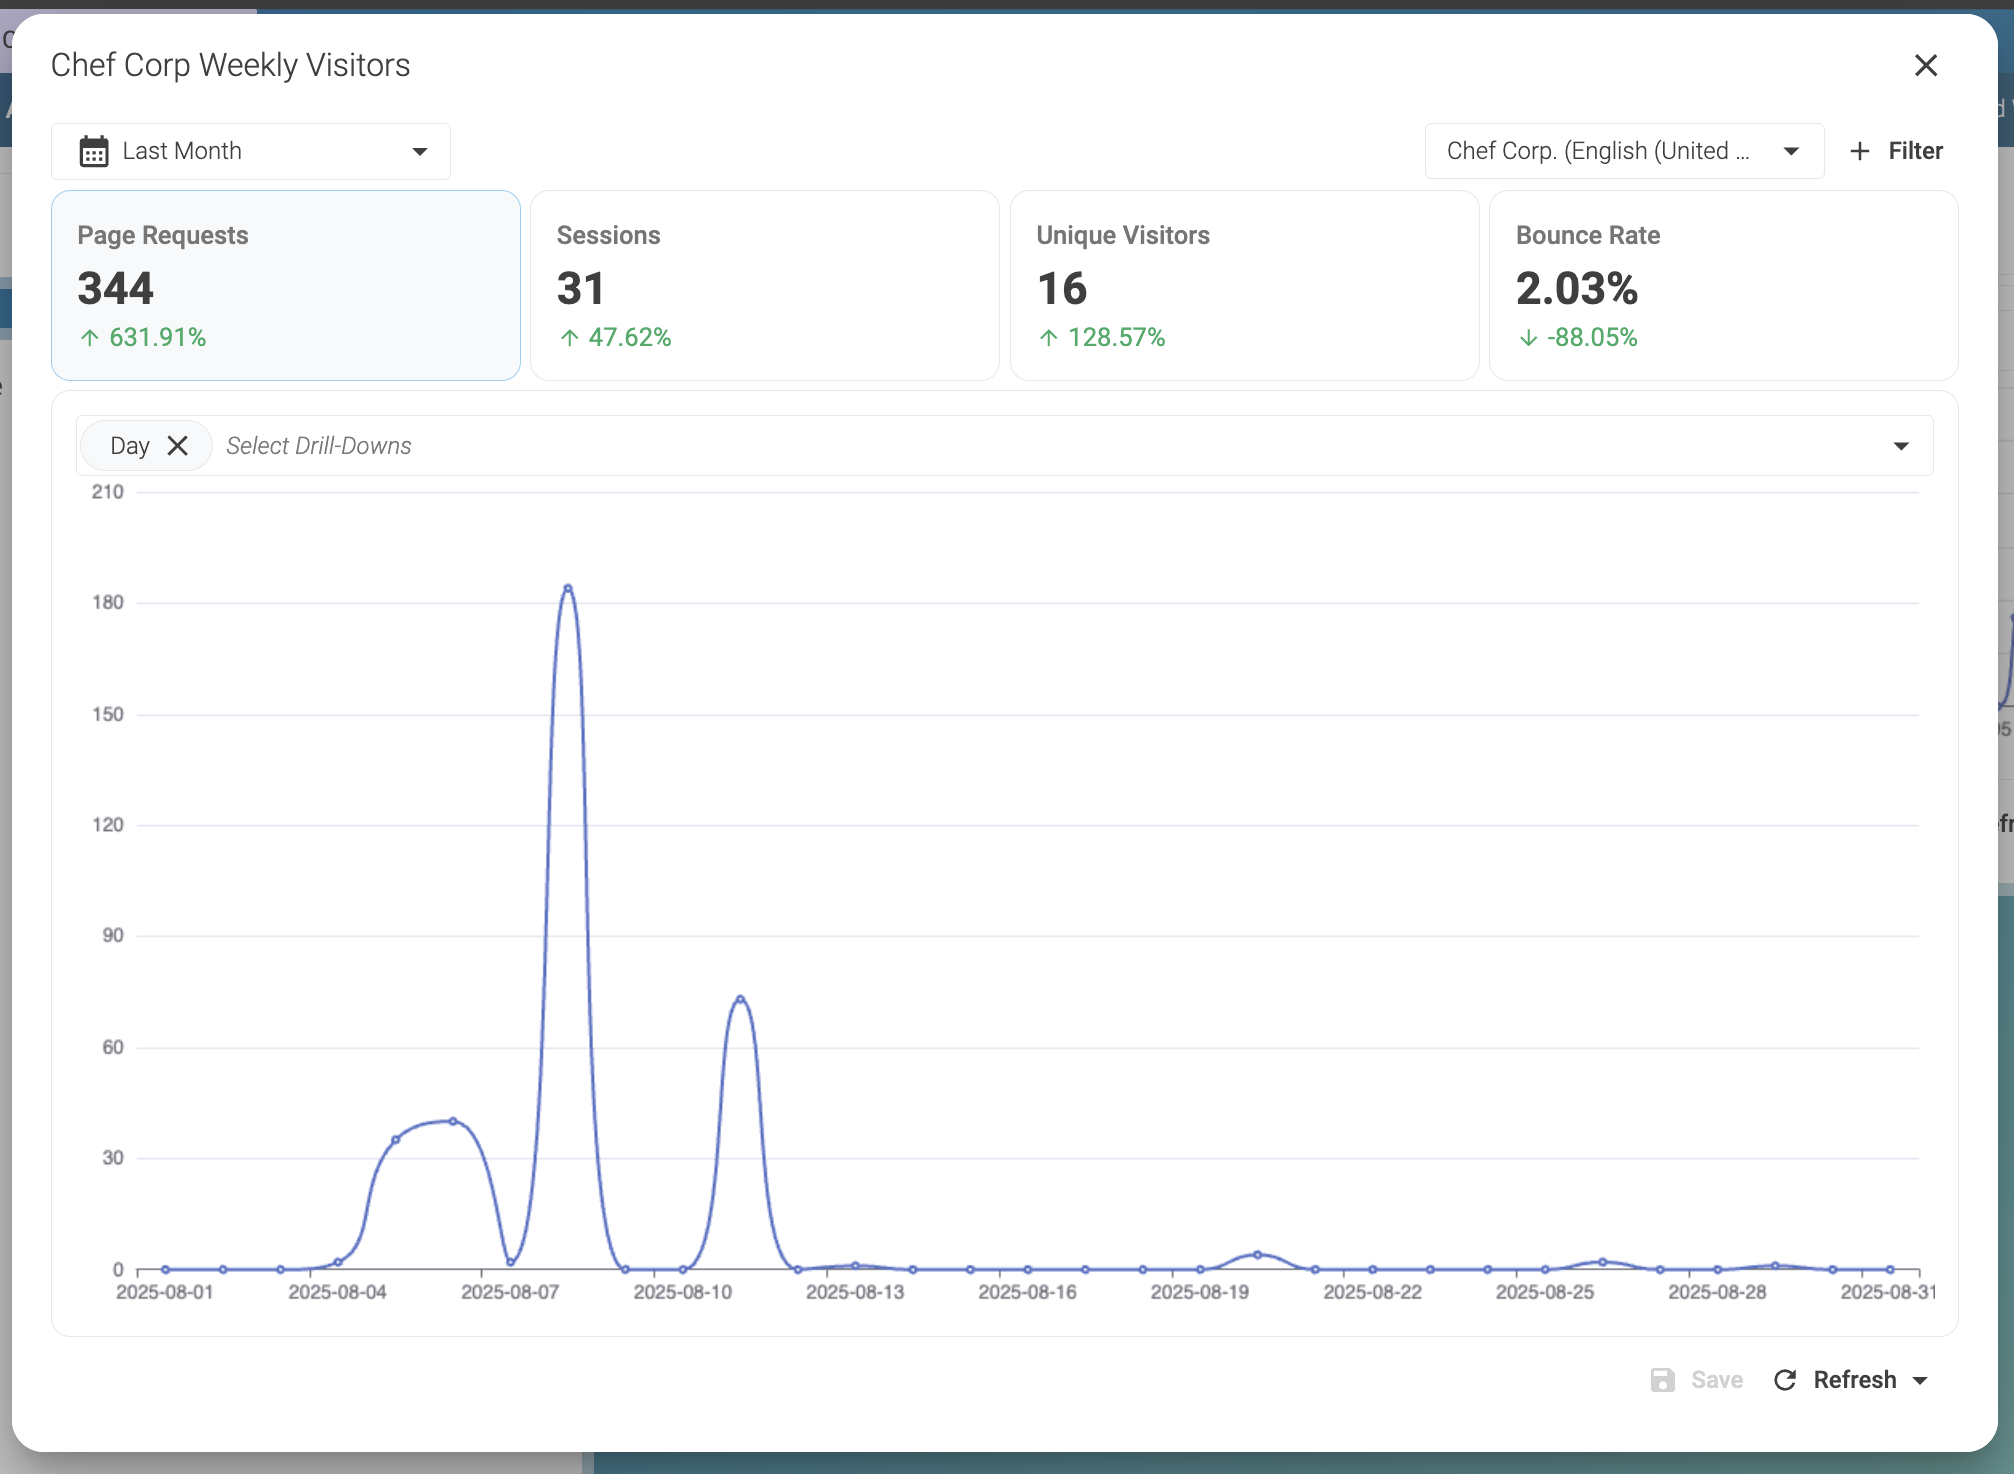
By default, the drill-down is Day with a line chart. When you change the drill-downs, the chart switches to a bar chart. In this example, the Website KPIs widget shows metrics for visitors from Germany, grouped by day of the week and by browser.
Related link: Drill-downs
3. Change metrics

The chart displays the selected metric. To change the metric, click a different one. For example, click Unique Visitors to view which days and browsers visitors used to access the site.
Click 💾 Save in the bottom-right corner of the Website KPIs widget.
Related link: Metrics
Result
After you click 💾 Save, the widget displays a bar chart with the number of unique visitors in August 2025, grouped by day of the week and browser.
In this example:
| Browser | Visitors |
|---|---|
Chrome |
5 |
Firefox |
1 |
Edge |
5 |

The next chart shows bounce rate. In this case, the only visitor who used Firefox on Friday left the website after the first page.
