


Studio Developer Manual / Version 2107
Table Of ContentsTo check whether your customized Studio contains any component leaks, proceed as follows.
-
First, you need to prepare your Studio carefully.
- Close all tabs in your Studio.
- Reload Studio.
-
Before opening any tabs, get rid of any tab reuse configuration by
entering the following in your browser's JavaScript console:
com.coremedia.ui.util.reusableComponentsService.reset()
Open the suspicious UI, for example, a document tab containing your new property field. If you want to check a document tab as a whole, you need to click through all subtabs and expand all collapsible panels as they contain lazy items. Wait until everything is rendered correctly and close the UI again. This is to ensure that helper components (a context menu, for instance) that are shared between instances and created with the first instance do not blur the view on real component leaks.
Store a snapshot of the current Ext component manager registry by executing the following command in the JavaScript console:
before = Ext.ComponentMgr.getAll()
Open and close the UI again like before. Take a second snapshot:
after = Ext.ComponentMgr.getAll()
In theory, the second snapshot should be exactly equal to the first. But some components are recreated occasionally, which is not bad if their old version is correctly destroyed. Thus, the first check is to simply compare the component count:
after.length - before.length
If there are more components in the second snapshot (positive difference), next goal is to determine their component type (xtype). This is achieved by the following code:
newComponents = after.filter(function(c) {
  return before.indexOf(c) === -1;
})
To get an overview of the new components, count how many components are of which type (xtype), using the following code:
byXtype = {};
newComponents.forEach(function(c) {
  var xtype = c.xtype;
  byXtype[xtype] = (byXtype[xtype] || 0) + 1;
});
byXtype
For custom MXML components, the xtypes in the resulting map indicate the config package, from which you can derive the Maven module, and the config class name, which corresponds to the MXML file name (using an upper case first letter).
To check whether your customized Studio contains any other memory leaks, proceed as follows.
Open the suspicious UI, for example, a document tab containing your new property field. Wait until everything is rendered correctly and close the UI again. In addition to what has been said regarding component leaks, this is to ensure that all needed data objects (remote beans) have been fetched from the server. In Studio, remote beans are cached, so they are not garbage-collected on purpose.
Take a heap snapshot. In Google Chrome, this is achieved as follows: In Developer Tools, select "Profiles". Under "Select profiling type", the option "Take Heap Snapshot" is preselected. The third option, "Record Heap Allocations", claims to be suitable for isolating memory leaks, but CoreMedia founds comparing heap snapshots simpler. Press the button "Take Snapshot". In the left column, Chrome adds an icon for the snapshot and shows a progress indicator while it is recorded. When recording is finished, the heap snapshot is shown as an expandable list of all JavaScript objects is shown, grouped by their (internal) type.
Repeat opening and closing the suspicious UI like in step 2.
Take a second heap snapshot. To do so, either you have to select "Profiles" on the left and proceed like in step 3, or simply click the "record" button (a gray filled circle).
Where the label "Summary" is shown, you can switch to "Comparison". The first snapshot is automatically selected for comparison. Now, you no longer see all objects, but only those that either have been removed ("Deleted") or have been created ("New") between snapshot one and two ("Delta").
Since the application is in the same state after opening and closing the suspicious UI, ideally, the comparison would be empty. In practice, however, this can never be achieved. What you have to look for are "expensive" objects, consuming lots of memory ("Alloc. Size", "Freed Size", "Size Delta"). The focus is "Size Delta", which tells you how much memory has leaked between snapshot one and two.
Since you cannot do much about memory leaks in Ext JS or in Studio Core, concentrate on your own extensions. Fortunately, Chrome's Profiler manages to find the Ext JS class names of objects. Thus, you can filter the comparison by the name of your ActionScript class, and it will only show objects of that class whose set of instances has changed.
Each entry in the upper part represents the set of all object. To inspect a concrete instance and its retainers, you have to expand the entry using the triangle / arrow, and select an instance from the expanded list. For the selected instance, all retainers are now shown in the lower part of the heap analyzer.
Each root node in the "Retainers" tree represents the property of the
instance directly referencing (retaining) the instance selected in the
upper part. By expanding any node, you can drill down into its retainers,
until you reach an instance that is globally retained, usually by
the global JavaScript object window.
By default, the heap analyzer sorts child nodes by "Distance" (first column), so that you inspect the longest path when always expanding the first child node. This most likely, but not necessarily leads you to the "culprit" retainer, that is the instance that should no longer refer to the inspected instance. Many other retainers result from cyclic references, that is, they would have been garbage-collected together with the inspected object, if the "culprit" did not reference the inspected object. This is why it is recommended to reduce the number of references by cleaning up fields and listeners, even if this would not have been necessary without the memory leak (see above).
Hopefully, by inspecting retainers, you'll find a listener that has not been detached or a global reference that should be removed on destroy. If not, you can still clean up your component or action so that it at least leaks less memory.
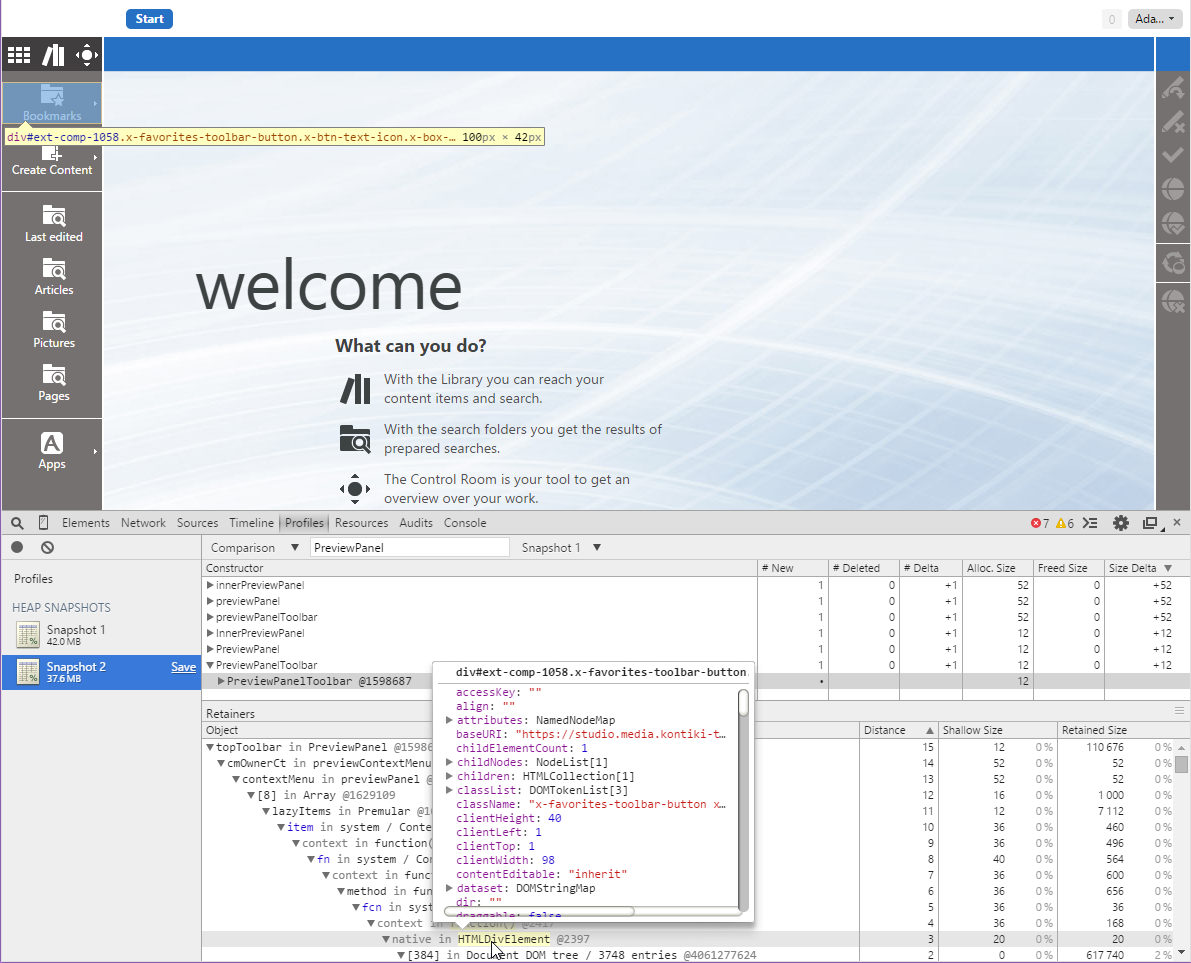
The screenshot shows Google Chrome's developer tools in action.
Blueprint Studio has been loaded in debug mode. A document tab has been opened
and closed again, "Snapshot 1" has been taken, and after repeating this,
"Snapshot 2" has been added. Then, both snapshots have been compared as
described above and the developer has filtered for "PreviewPanel".
The only retained instance of PreviewPanelToolbar has been selected,
so that its retainers are shown in the lower part.
In the expanded path, the mouse hovers over the almost-leaf HTMLDivElement,
which is also automatically highlighted in the Studio UI. This reveals the culprit
of the memory leak: The highlighted "Bookmarks" button in the favorites toolbar is
the one who keeps an indirect reference to the PreviewPanel through its
context menu.
