


Studio Developer Manual / Version 2201
Table Of ContentsStudio Console Logging
By default, all JavaScript console errors that occur in Studio are logged in the backend as well.
The errors are logged into the file studio-console.log.
Additionally, the user can enable the Log button for debugging purposes.
When using the hash parameter joo.debug a button with a counter will appear next to the
user menu,which captures all log messages that are sent to the server as well.
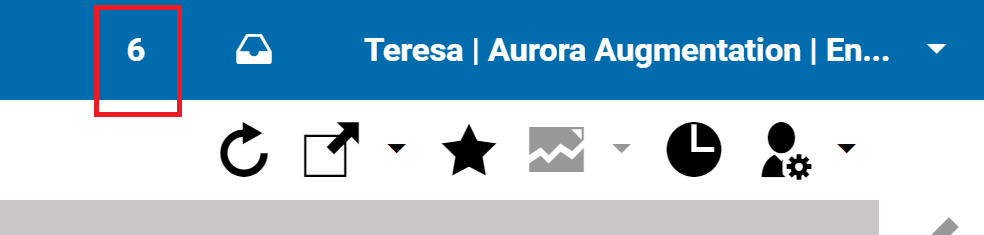
A click on the button shows the console log messages. Longer messages provide a tooltip so that the full stacktrace of errors can be seen. The amount of stored messages is limited to the last 300 by default.
The logging is configurable via the Studio resource bundle LogSettings_properties.ts which may be overwritten.
The properties file contains the following configuration options:
whitelist: a comma separated list of messages. If a log message matches a part of one of these values, it is ignored for logging.
cache_size: the number of messages kept in the browser log window (100 by default).
Dump content to browser console
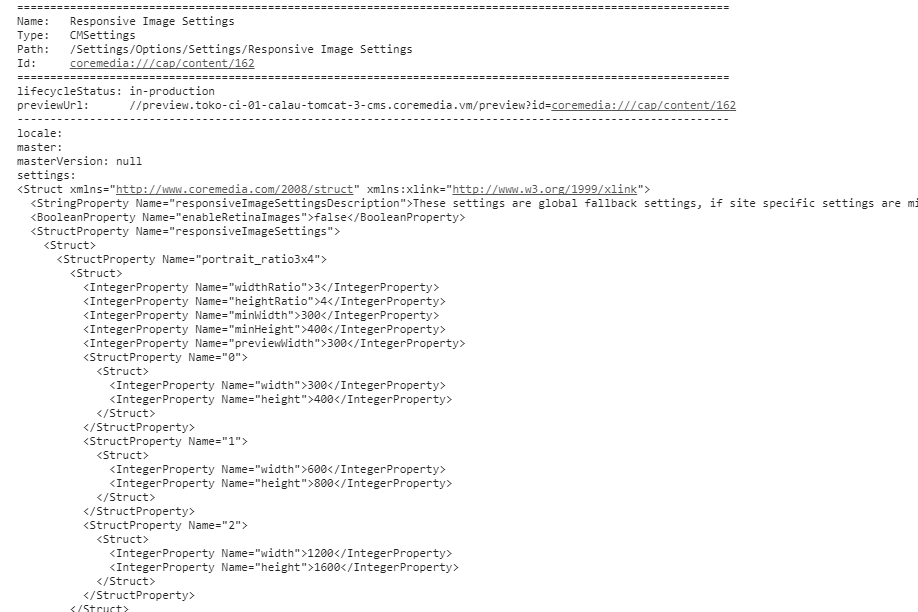
You can use a shortcut to dump a readable representation of a content item to the browser console. Open the content item in a form and press the shortcut CTRL+ALT+D.
Inspecting an Ext JS component in the developer tools console
The DOM elements of Ext JS components can be identified in the Studio DOM tree. The value of the
id attribute of a DOM element resembles the xtype of the corresponding Ext JS component,
for example, the issues window has xtype com.coremedia.cms.editor.sdk.config.issuesWindow. The ID value is
com-coremedia-cms-editor-sdk-config-issuesWindow-nnnn where nnnn is an arbitrary unique
integer value. Be careful, the DOM element often contains subelements with similar id values, for example, there is a
subelement with id value com-coremedia-cms-editor-sdk-config-issuesWindow-nnnn-bodyWrap. This DOM
element does not represent an Ext JS component.
Now select and copy the id value from the DOM element. You get an Ext JS component from the id value by invoking
the method Ext.getCmp(id) in the console. For example to inspect the issues window component enter:
c=Ext.getCmp("com-coremedia-cms-editor-sdk-config-issuesWindow-nnnn");

c.items.items;
The next section shows another possibility to inspect Ext JS components.
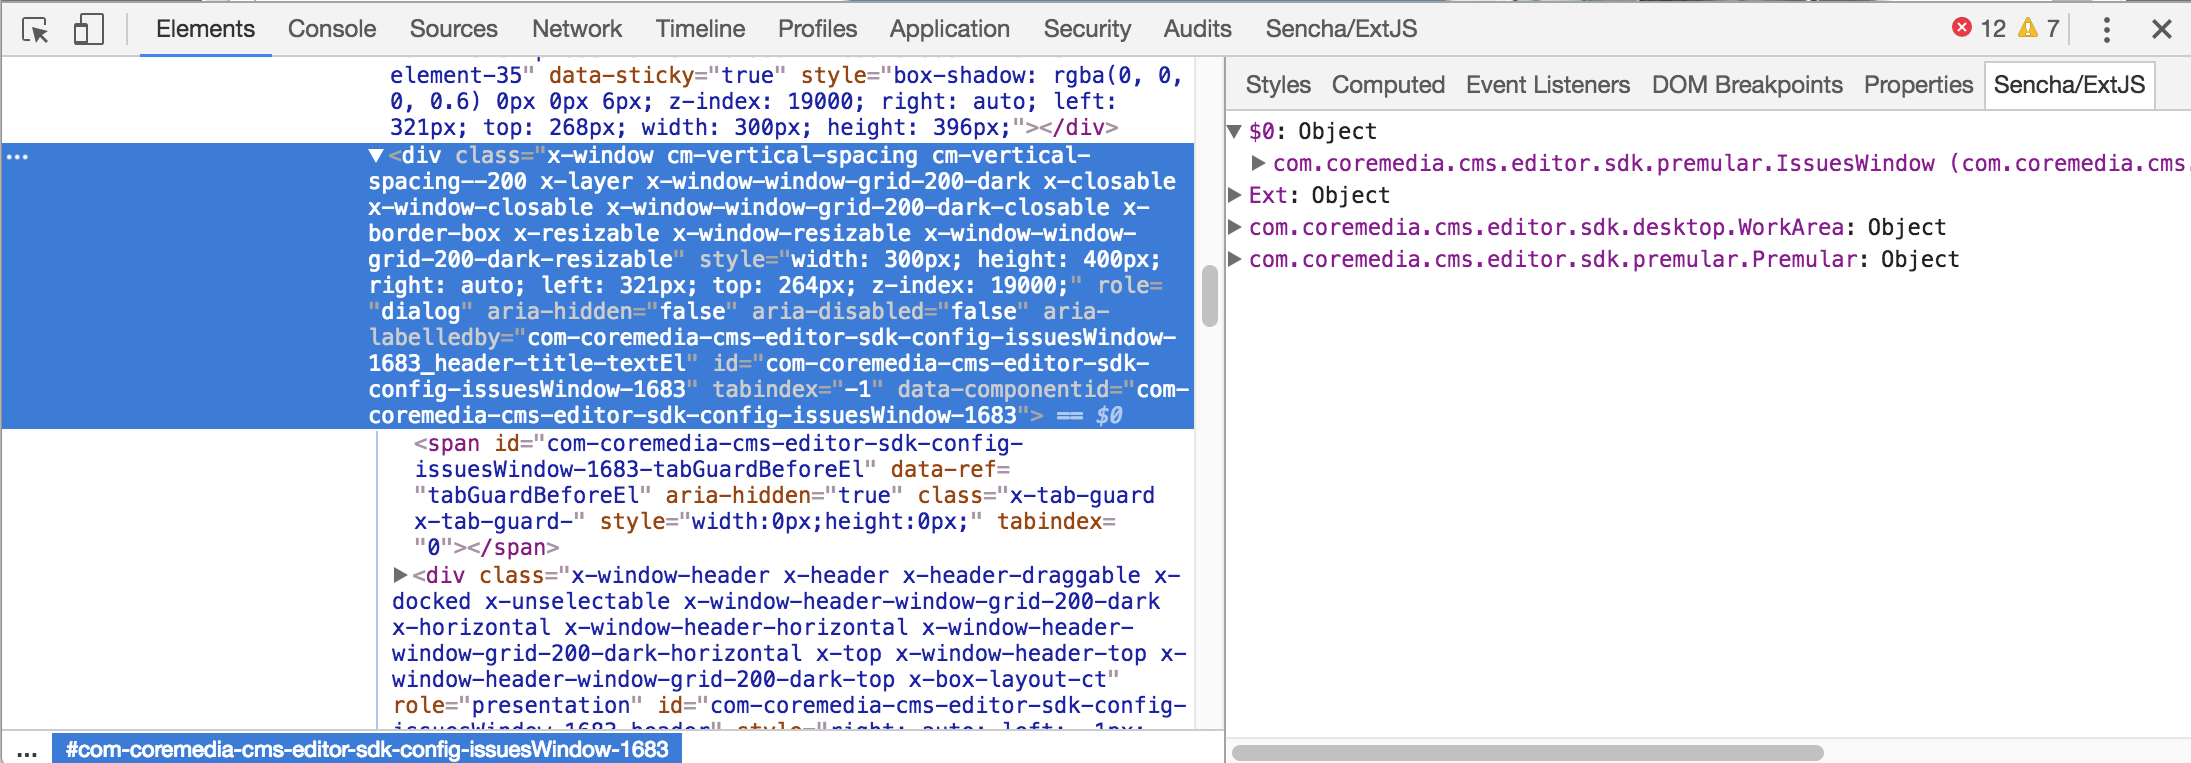
Inspecting an Ext JS component in the developer tools Elements tab
To inspect an Ext JS component you can install the Sencha and Ext JS Debugger extension for Google Chrome. When installed, an additional tab named Sencha/Ext JS is added to the submenu of the Elements tab in the developer tools. When you select a DOM element in the Studio DOM tree, the Sencha/Ext JS tab shows a list of Ext JS components. The component labeled $0 shows the selected component. The other list components are the ancestors of the selected component. When you select a different DOM element in the DOM tree, the components in the Sencha/Ext JS tab are updated accordingly.
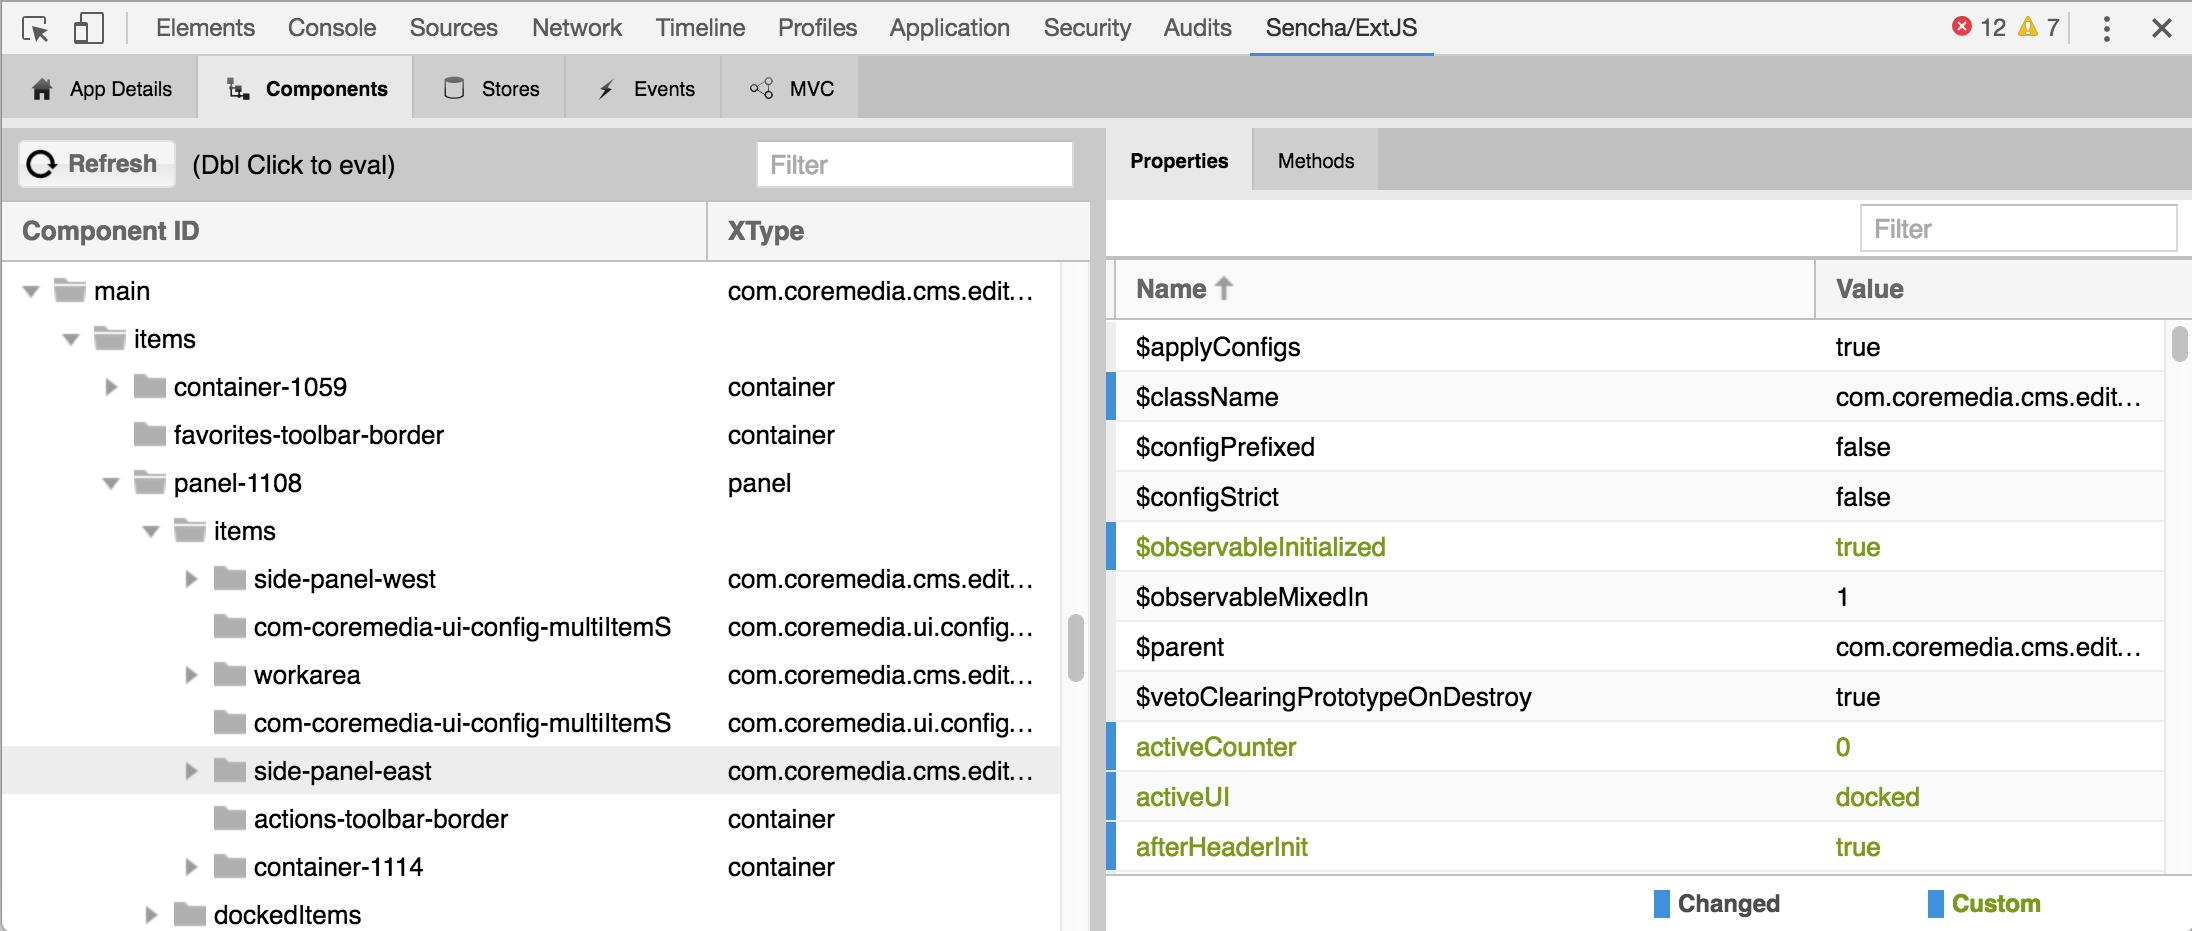
Navigating the complete Studio Ext JS component tree
To navigate the Studio Ext JS component tree you can install the Sencha and Ext JS Debugger extension for Google Chrome. When installed, an additional tab named Sencha/Ext JS is added to the developer tools menu. This tab contains a subtab Components where you see a list of Ext JS component trees. From the list select the main component id which represents the Studio main view component and navigate through its subcomponents.
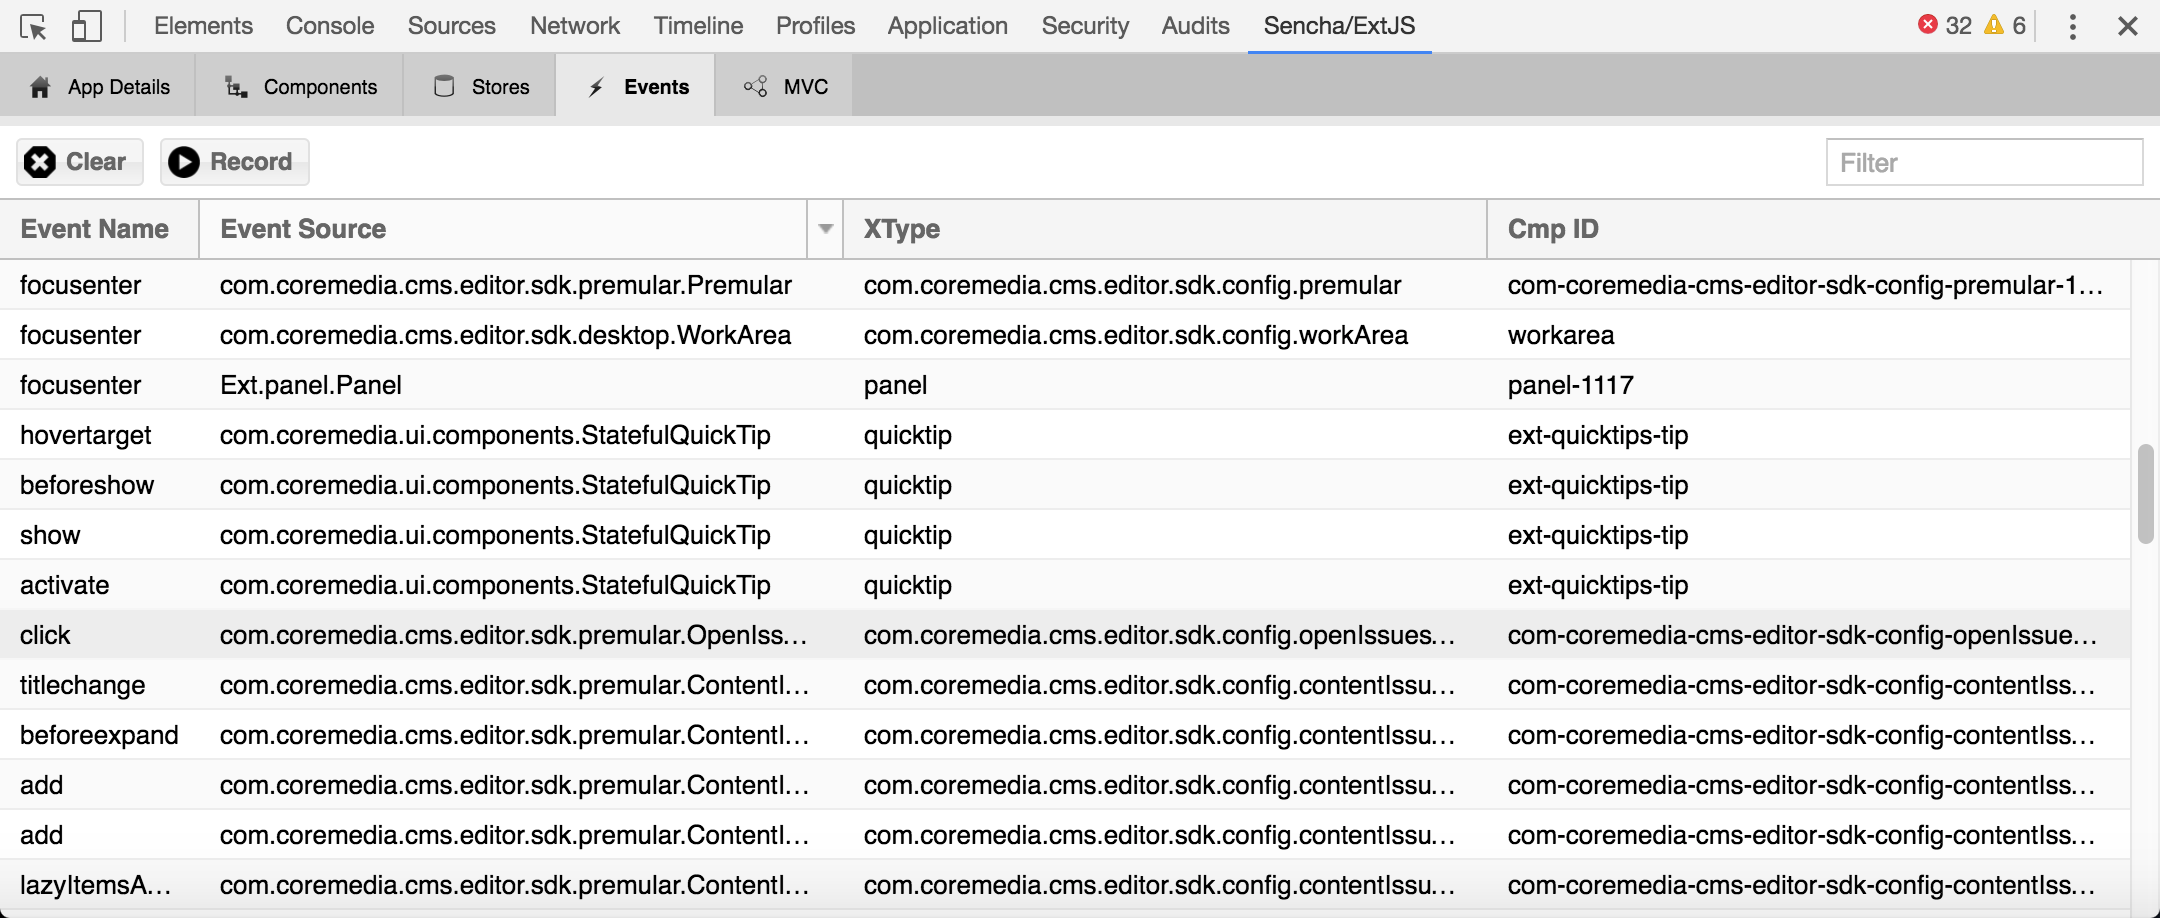
Recording Ext JS component events
To record a list of Ext JS component events you can install the Sencha and Ext JS Debugger extension for Google Chrome. When installed, an additional tab named Sencha/Ext JS is added to the developer tools menu. This tab contains a subtab Events where you can record the component events. To start recording click on the Record button. To stop the recording click on the button again. A list of events with event name, event source, xtype and component id is displayed.
Trigger the debugger when a component property is modified
Sometimes you want to know why a property of a certain Ext JS component was modified. You can trigger the Chrome debugger to stop at a breakpoint you define for the property change in the console of the developer tools. In the following example the debugger stops when you change the height of the issues window.
c=Ext.getCmp("com-coremedia-cms-editor-sdk-config-issuesWindow-nnnn");

c._height = c.height;

Object.defineProperty(c, "height",
                      {get: function() {return this._height;},
                       set : function(val) {debugger; this._height = val;}})
The first line assigns the issues window component to the variable c as described in the
component inspection section above.
The second line defines a new variable _height to store the height property value.
The last lines define the getter and setter methods of the height property. The debugger
command in the setter tells the debugger to stop at the same position. Now the user can analyze the
call hierarchy, inspect other component values and continue debugging.
Debug and Understand CKEditor Data Processing
CKEditor provides a mechanism to transform CKEditor's HTML into the data format used for storing the text and vice versa. CoreMedia Studio uses CKEditor's data processing to transform CoreMedia RichText into CKEditor's HTML and vice versa.
CKEditor's data processing is split into 15 stages. At each stage different artifacts are available for transformation. Data processing in CoreMedia Studio involves several stages to process links, transform headings, etc.
If you want to further adapt the data processing or need to configure a CKEditor plugin which interacts with data processing, it might be helpful to see the different stages of data processing in the browser's developer tools.
In order to see the different stages of data processing, start CoreMedia Studio with the URL hash parameter
ckdebug. To see every single stage of data processing, use the URL hash parameter
ckdebug=verbose. Example: http://localhost:8080/studio/#ckdebug=verbose
coreMediaRichTextArea-1434:toDataFormat/1 (Input):
 Object {value: "<p>This is a <strong>ckdebug</strong> example.</p>"}
coreMediaRichTextArea-1434:toDataFormat/15 (Output):
 Object {value: "<div xmlns="http://www.coremedia.com/2003/richtext… is a <strong>ckdebug</strong> example.</p></div>"}
Example 8.1. ckdebug, non-verbose
coreMediaRichTextArea-1434:toHtml/1:
  Object {value: "<?xml version="1.0" encoding="utf-8"?><div xmlns=… is a <strong>ckdebug</strong> example.</p></div>"}
coreMediaRichTextArea-1434:toHtml/2:
 Object {value: "<?xml version="1.0" encoding="utf-8"?><div xmlns=… is a <strong>ckdebug</strong> example.</p></div>"}
coreMediaRichTextArea-1434:toHtml/3:
 Object {value: "<div xmlns="http://… is a <strong>ckdebug</strong> example.</p></div>"}
coreMediaRichTextArea-1434:toHtml/4:
 Object {value: "<div xmlns="http://… is a <strong>ckdebug</strong> example.</p></div>"}
coreMediaRichTextArea-1434:toHtml/5:
 Object {value: C…R.h…r.element, asHtml: "<div xmlns="http://… is a <strong>ckdebug</strong> example.</p></div>"}
coreMediaRichTextArea-1434:toHtml/6:
 Object {value: C…R.h…r.element, asHtml: "<p>This is a <strong>ckdebug</strong> example.</p>"}
coreMediaRichTextArea-1434:toHtml/7:
...
coreMediaRichTextArea-1434:toHtml/14:
 Object {value: C…R.h…r.element, asHtml: "<p>This is a <strong>ckdebug</strong> example.</p>"}
coreMediaRichTextArea-1434:toHtml/15:
 Object {value: "<p>This is a <strong>ckdebug</strong> example.</p>"}
Example 8.2. ckdebug, verbose
In the examples (Example 8.1, “
ckdebug, non-verbose
” and Example 8.2, “
ckdebug, verbose
”)
you see an example output where toHtml is the direction when transforming CoreMedia RichText
from server into CKEditor's HTML and toDataFormat is the direction when storing
CKEditor's HTML as CoreMedia RichText on the server.
For additional reference of CKEditor's data processing it is recommended that you read the corresponding documentation of the events in the CKEditor API documentation:
