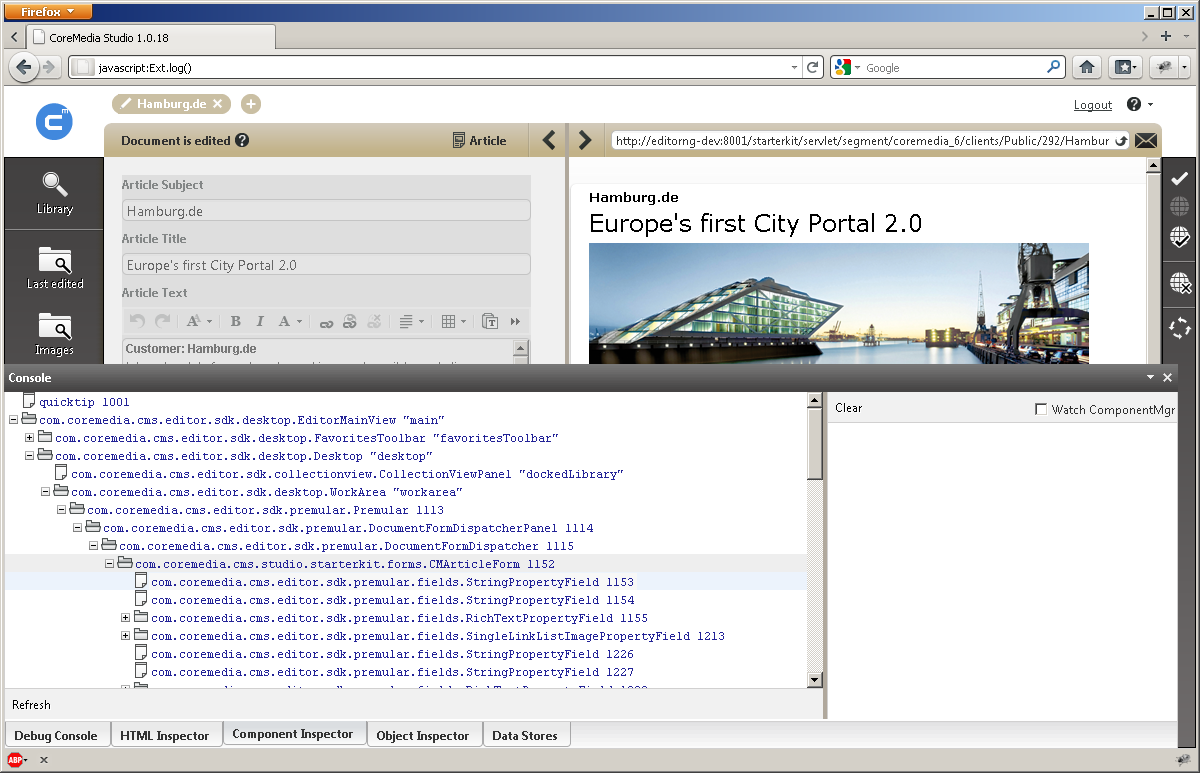
Ext JS comes with a built-in debug console. Before you can use the console, you have to run
CoreMedia Studio in debug mode by appending the
#joo.debug URL parameter as described in the previous section. Then, you can
activate the console by executing
Ext.log();
in the JavaScript console. The Ext debug console offers capabilities tailored for debugging the Ext component tree.
The Component Inspector tab shows the Ext component tree,
displaying the components' xtypes and
ids. The element associated with the selected node is
highlighted. The figure below shows that the properties form of the active article is
highlighted when the component of xtype CMArticleForm
with id 1152 is selected. Double-clicking this component
opens a new view showing the properties of this component.
The Ext debug console also offers capabilities to explore the HTML structure of the current document and to execute JavaScript. However, compared to the browser's developer tools, these capabilities are rather limited.


