


Studio Developer Manual / Version 2506.0
Table Of ContentsStudio Console Logging
By default, all JavaScript console errors that occur in Studio are logged in the backend as well.
The errors are logged into the file studio-console.log.
Additionally, the user can enable the Log button for debugging purposes.
When using the hash parameter joo.debug a button with a counter will appear next to the
user menu,which captures all log messages that are sent to the server as well.
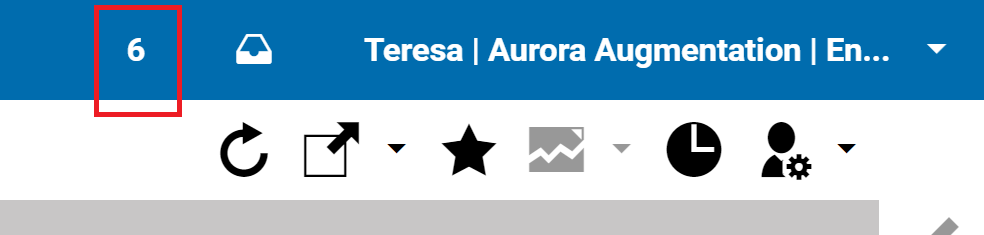
A click on the button shows the console log messages. Longer messages provide a tooltip so that the full stacktrace of errors can be seen. The amount of stored messages is limited to the last 300 by default.
The logging is configurable via the Studio resource bundle LogSettings_properties.ts which may be overwritten.
The properties file contains the following configuration options:
whitelist: a comma separated list of messages. If a log message matches a part of one of these values, it is ignored for logging.
cache_size: the number of messages kept in the browser log window (100 by default).
Dump content to browser console
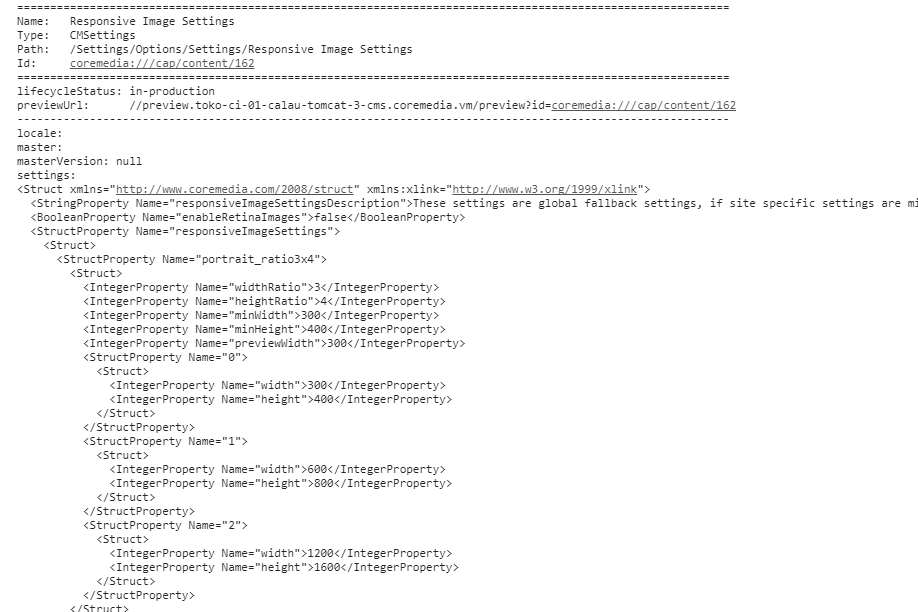
You can use a shortcut to dump a readable representation of a content item to the browser console. Open the content item in a form and press the shortcut CTRL+ALT+D.
Inspecting an Ext JS component in the developer tools console
The DOM elements of Ext JS components can be identified in the Studio DOM tree. The value of the
id attribute of a DOM element resembles the xtype of the corresponding Ext JS component,
for example, the issues window has xtype com.coremedia.cms.editor.sdk.config.issuesWindow. The ID value is
com-coremedia-cms-editor-sdk-config-issuesWindow-nnnn where nnnn is an arbitrary unique
integer value. Be careful, the DOM element often contains subelements with similar id values, for example, there is a
subelement with id value com-coremedia-cms-editor-sdk-config-issuesWindow-nnnn-bodyWrap. This DOM
element does not represent an Ext JS component.
Now select and copy the id value from the DOM element. You get an Ext JS component from the id value by invoking
the method Ext.getCmp(id) in the console. For example to inspect the issues window component enter:
c=Ext.getCmp("com-coremedia-cms-editor-sdk-config-issuesWindow-nnnn");

c.items.items;
Trigger the debugger when a component property is modified
Sometimes you want to know why a property of a certain Ext JS component was modified. You can trigger the Chrome debugger to stop at a breakpoint you define for the property change in the console of the developer tools. In the following example the debugger stops when you change the height of the issues window.
c=Ext.getCmp("com-coremedia-cms-editor-sdk-config-issuesWindow-nnnn");

c._height = c.height;

Object.defineProperty(c, "height",
                      {get: function() {return this._height;},
                       set : function(val) {debugger; this._height = val;}})
The first line assigns the issues window component to the variable c as described in the
component inspection section above.
The second line defines a new variable _height to store the height property value.
The last lines define the getter and setter methods of the height property. The debugger
command in the setter tells the debugger to stop at the same position. Now the user can analyze the
call hierarchy, inspect other component values and continue debugging.
Debug and Understand CKEditor Data Processing
To debug the richtext editing component based on CKEditor, you may
add a hash parameter ckdebug to the CoreMedia Studio
URL. For details, see Section 10.4, “Debugging CKEditor 5”.
