     100 * (metric in period 2 - metric in period 1)
% =  ----------------------------------------------
                  metric in period 1
Creating a Metric Panel
Last updated 16 minutes ago
Learn how to create and configure a metric panel with more than one dimension. A dimension is a data source.
Table of Contents
Learn how to create and configure a panel with metrics from several dimensions. A dimension is a data source. For each dimension, select metrics and configure the period for the data. You can also choose to view the change rate between consecutive periods.
Prerequisites
-
Have a user with permissions to use CCAS.
-
Have, at least, created one Dashboard.
Steps
1. Add a new panel to the dashboard
-
In bottom right corner of a dashboard, click button plus
 .
. -
In window Add Panel, select Metric Panel.
2. Configure the metric panel
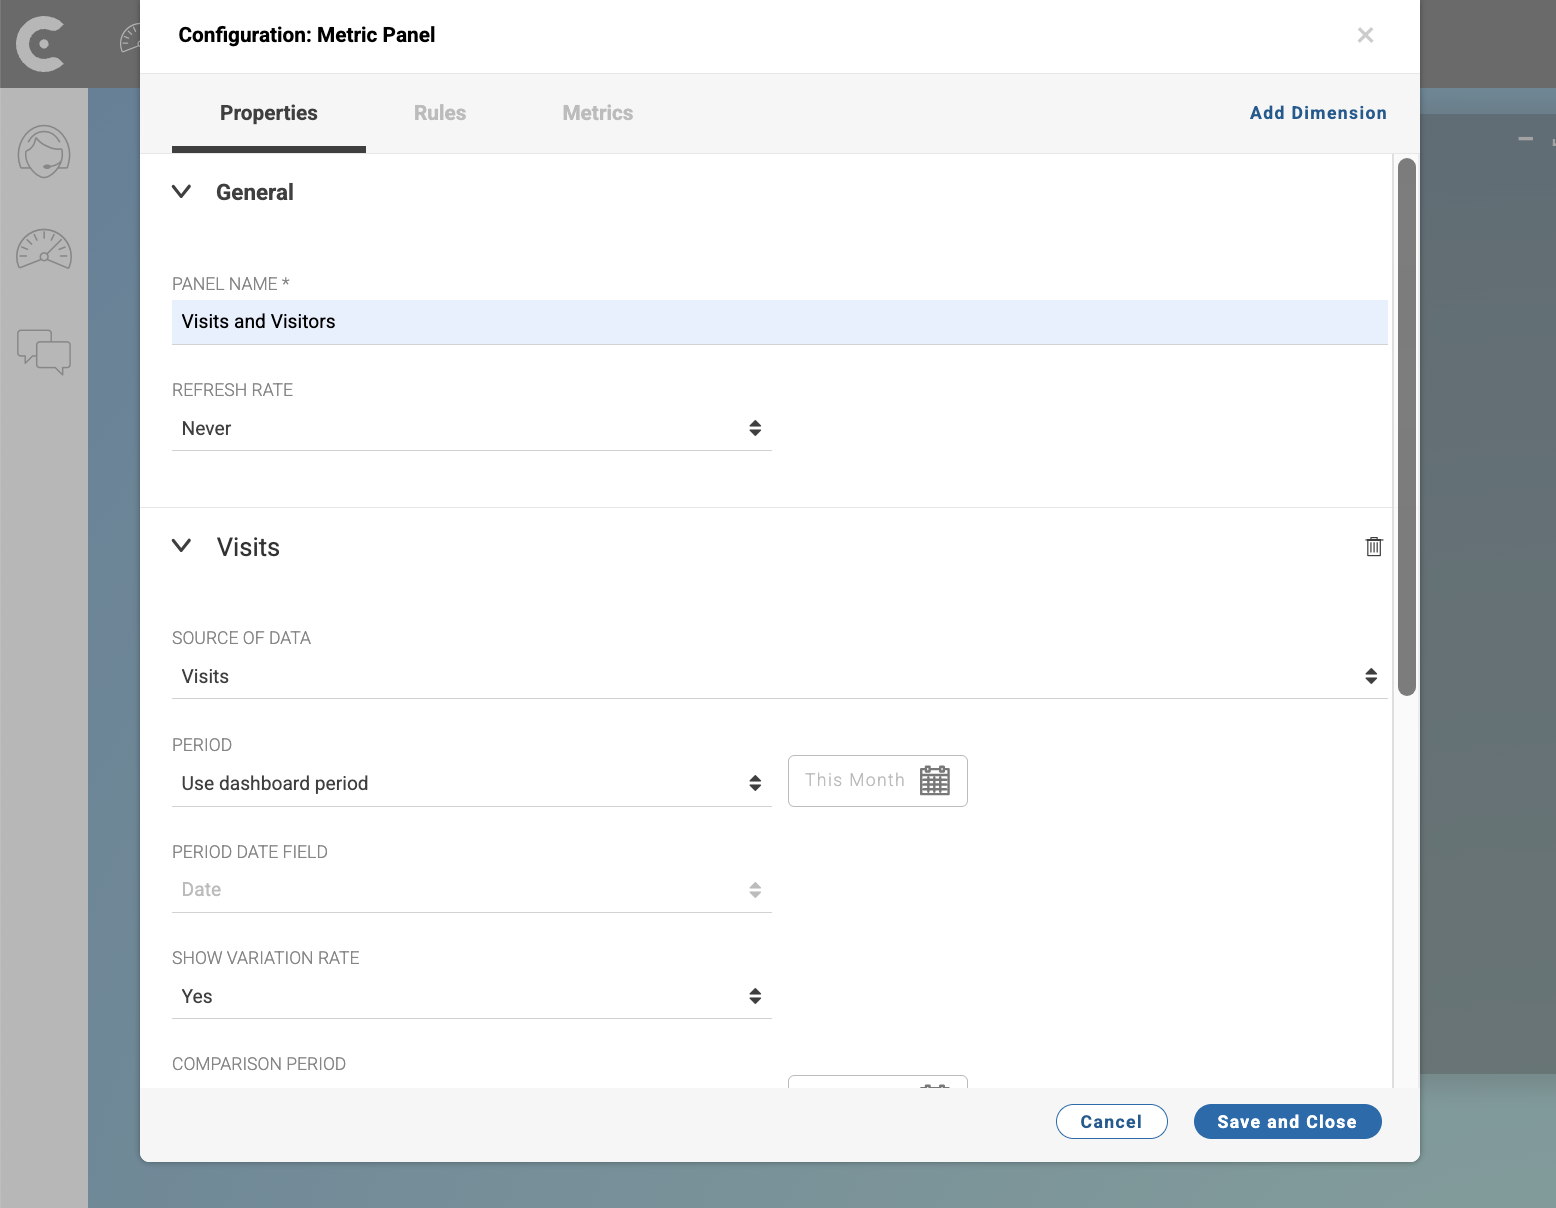
In Properties tab of window Configuration: Metrics Panel, configure the panel:
-
NAME: Name for the panel. For example,
Visits and Visitors.
In the Dimension 1 accordion, configure the first dimension:
-
Click Dimension 1 to change the name of the dimension. For example,
Visits. -
SOURCE OF DATA: Select the data source that you want to view in the panel. For example,
Visits. -
PERIOD: Define the period for the data.
-
PERIOD DATE ORIGIN: Define the type of date origin that CCAS should use to filter the data. For example, if you select
Creation Date, CCAS will filter the data based on the creation date, but if you selectEnd DateCCAS will filter the data based on the end date. In the case ofVisits, you cannot change the PERIOD DATE ORIGIN. -
SHOW VARIATION RATES: Select
Yes.
Note that, by default, the dimensions inherit the period defined in the dashboard.
Reference: Configuration: Metric Panel
Click button Save and Close
Result
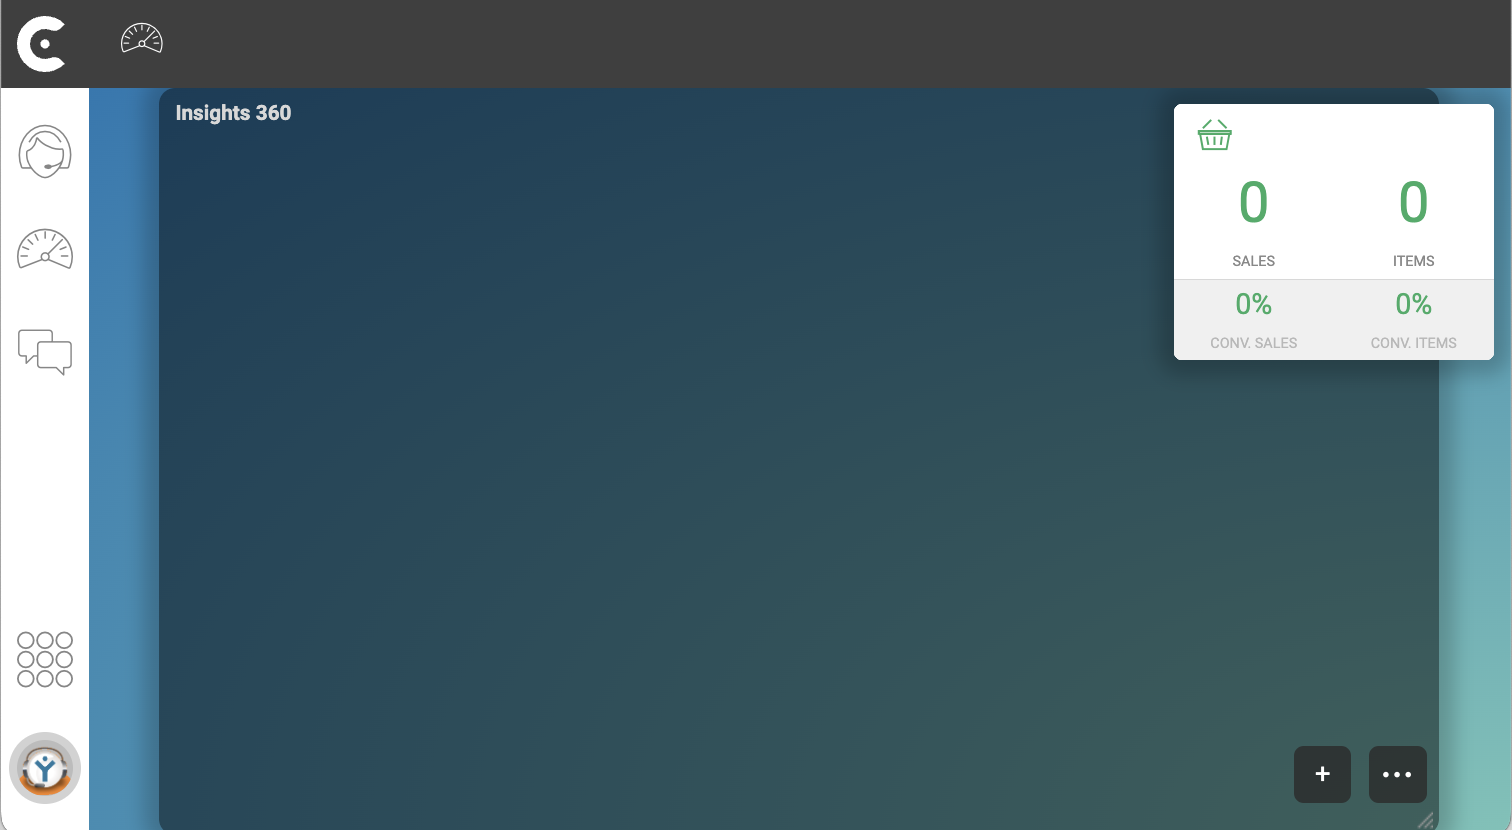
After you finish the previous steps, the created panel appears in your dashboard. In the following image, the metric panel shows the number of visits, pages requests, and unique visitors of the documentation site during the month of February 2025.
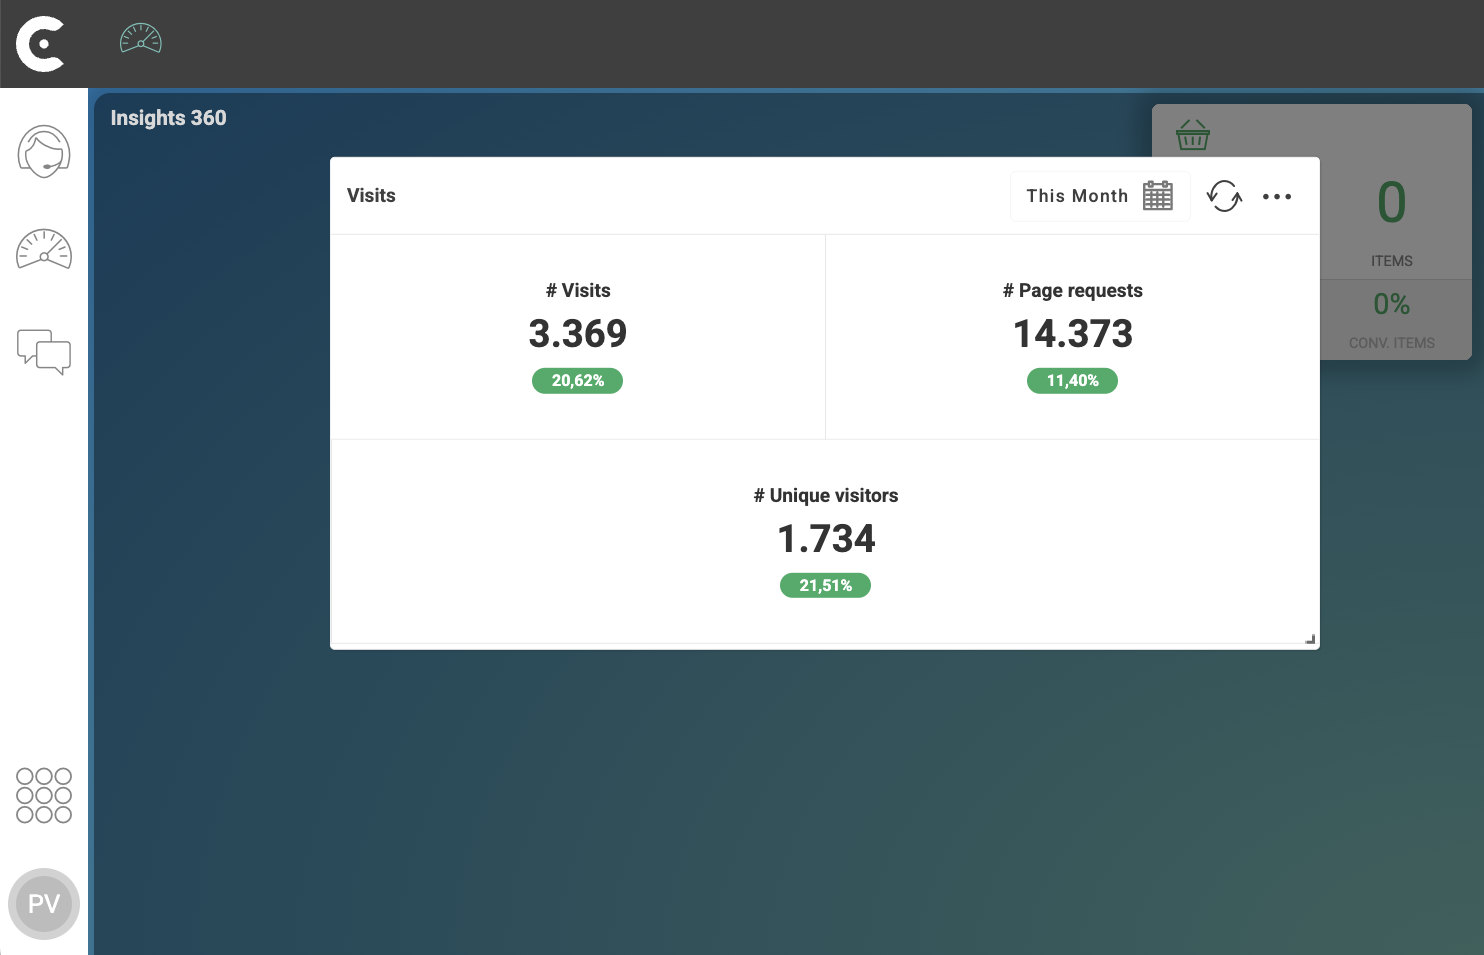
Calculating change rates
The percentage below each metric represents the change rate between the values of the metric in two consecutive periods. To calculate the change rates of the metrics, Contact Center and Analytics Studio compares the values of the metrics in period N and period N-1.
Contact Center and Analytics Studio calculates the change rates of the metrics based on the following formula:
In the following image, the metric panel shows the number of visits, pages requests, and unique visitors of the documentation site during the month of January 2025.
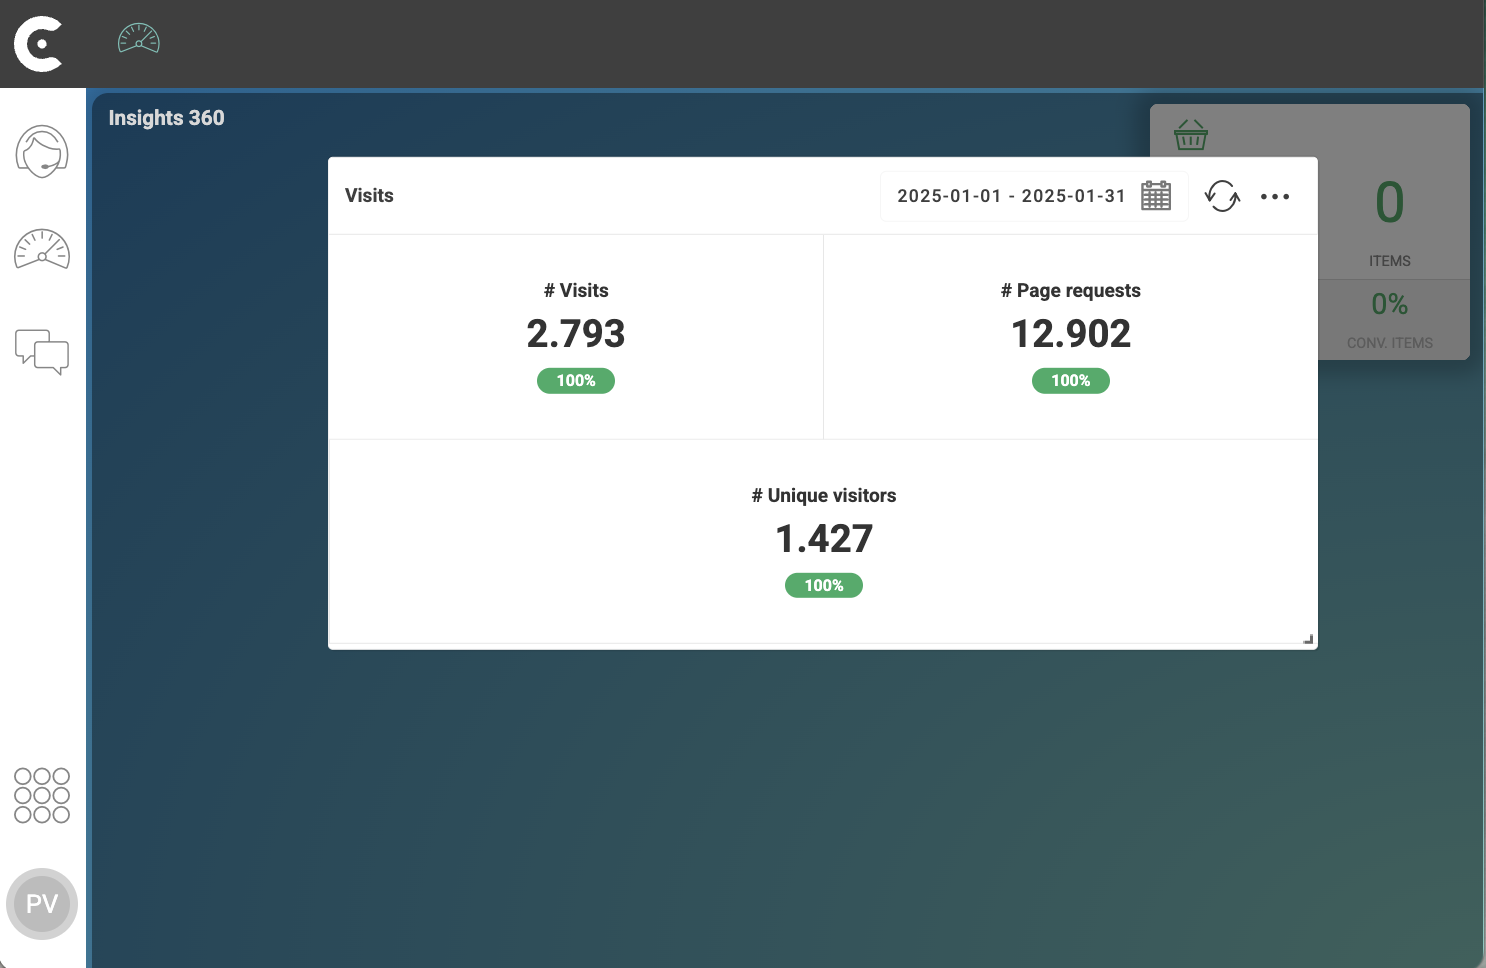
Comparing the values of the metrics in February 2025 and January 2025, the change rates, Contact Center and Analytics Studio calculates change rates as follows:
| Period | January 2025 | February 2025 | % Change |
|---|---|---|---|
# Visits |
2.793 |
3.369 |
|
# Page Requests |
12.902 |
14.373 |
|
# Unique Visitors |
1.427 |
1.734 |
|
Is this page useful?