Solution Overview for Business Users / Version 2512.0
Table Of ContentsPrerequisites
Before you start:
Ensure that you have version 12.2506.0.0 or later of the Content Studio.
Ensure that Native Personalization Plugin is installed.
Log in to Content Studio and open the Dashboard.
Open a page or an article.

Note
Content Studio provides page performance data only for content items of type
page and article. You can open the
Metrics tab for other content types, but the metrics
and the detailed performance table show only 0 values.
Steps
Click More Options (…) in the tabs menu.
Select the Metrics tab.
Click Last 30 Days in the top-left corner of the Detailed Page Performance area. For example, select Last Month to view metrics for August 2025.
Note
Related link: Data Period
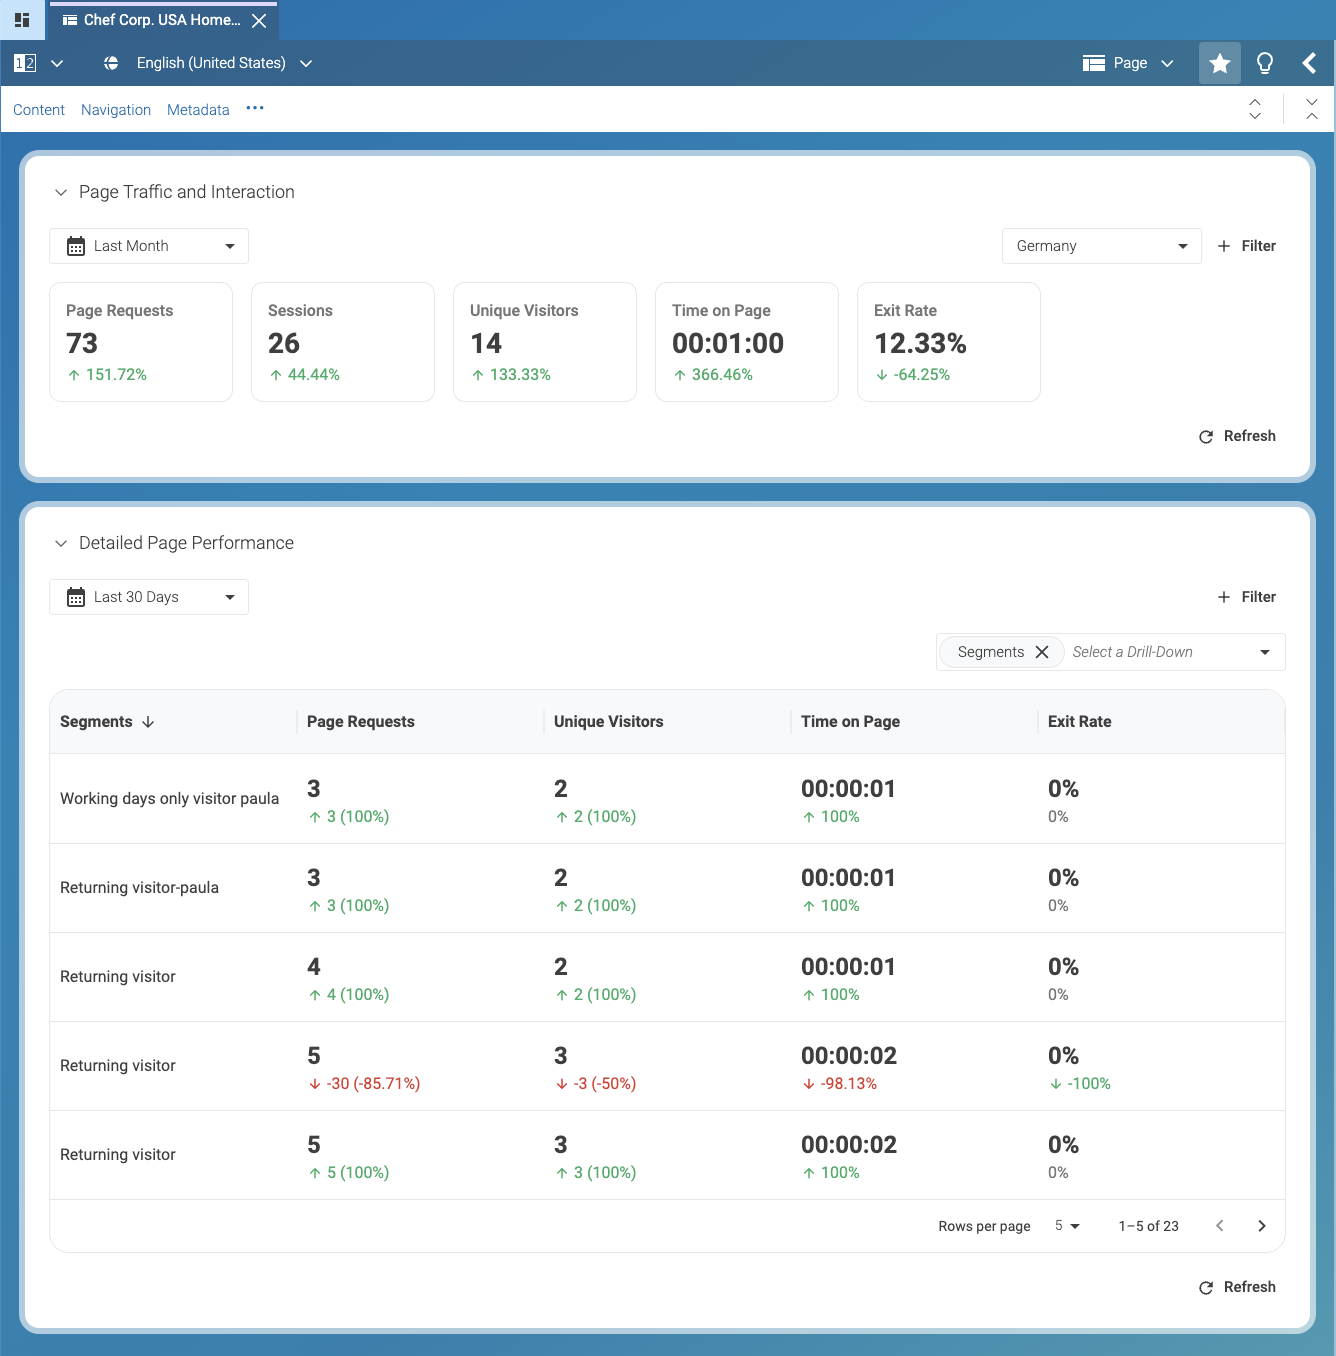
Click + Filter in the top-right corner of the Detailed Page Performance area.
From the dropdown menu, select a filter:
Segments: View data by visitor segments.
Country: View data by visitor location. For example:
Portugal,Spain, orGermany.Device: View data by device type. For example:
Desktop,Tablet, orMobile.
After you select a filter, a second dropdown menu appears next to + Filter. For example, select
Country, then selectGermanyfrom the list of countries.
Click the Drill-down dropdown menu below + Filter.
Select a drill-down. For example, select
Day of Week. By default, the drill-down isSegment.
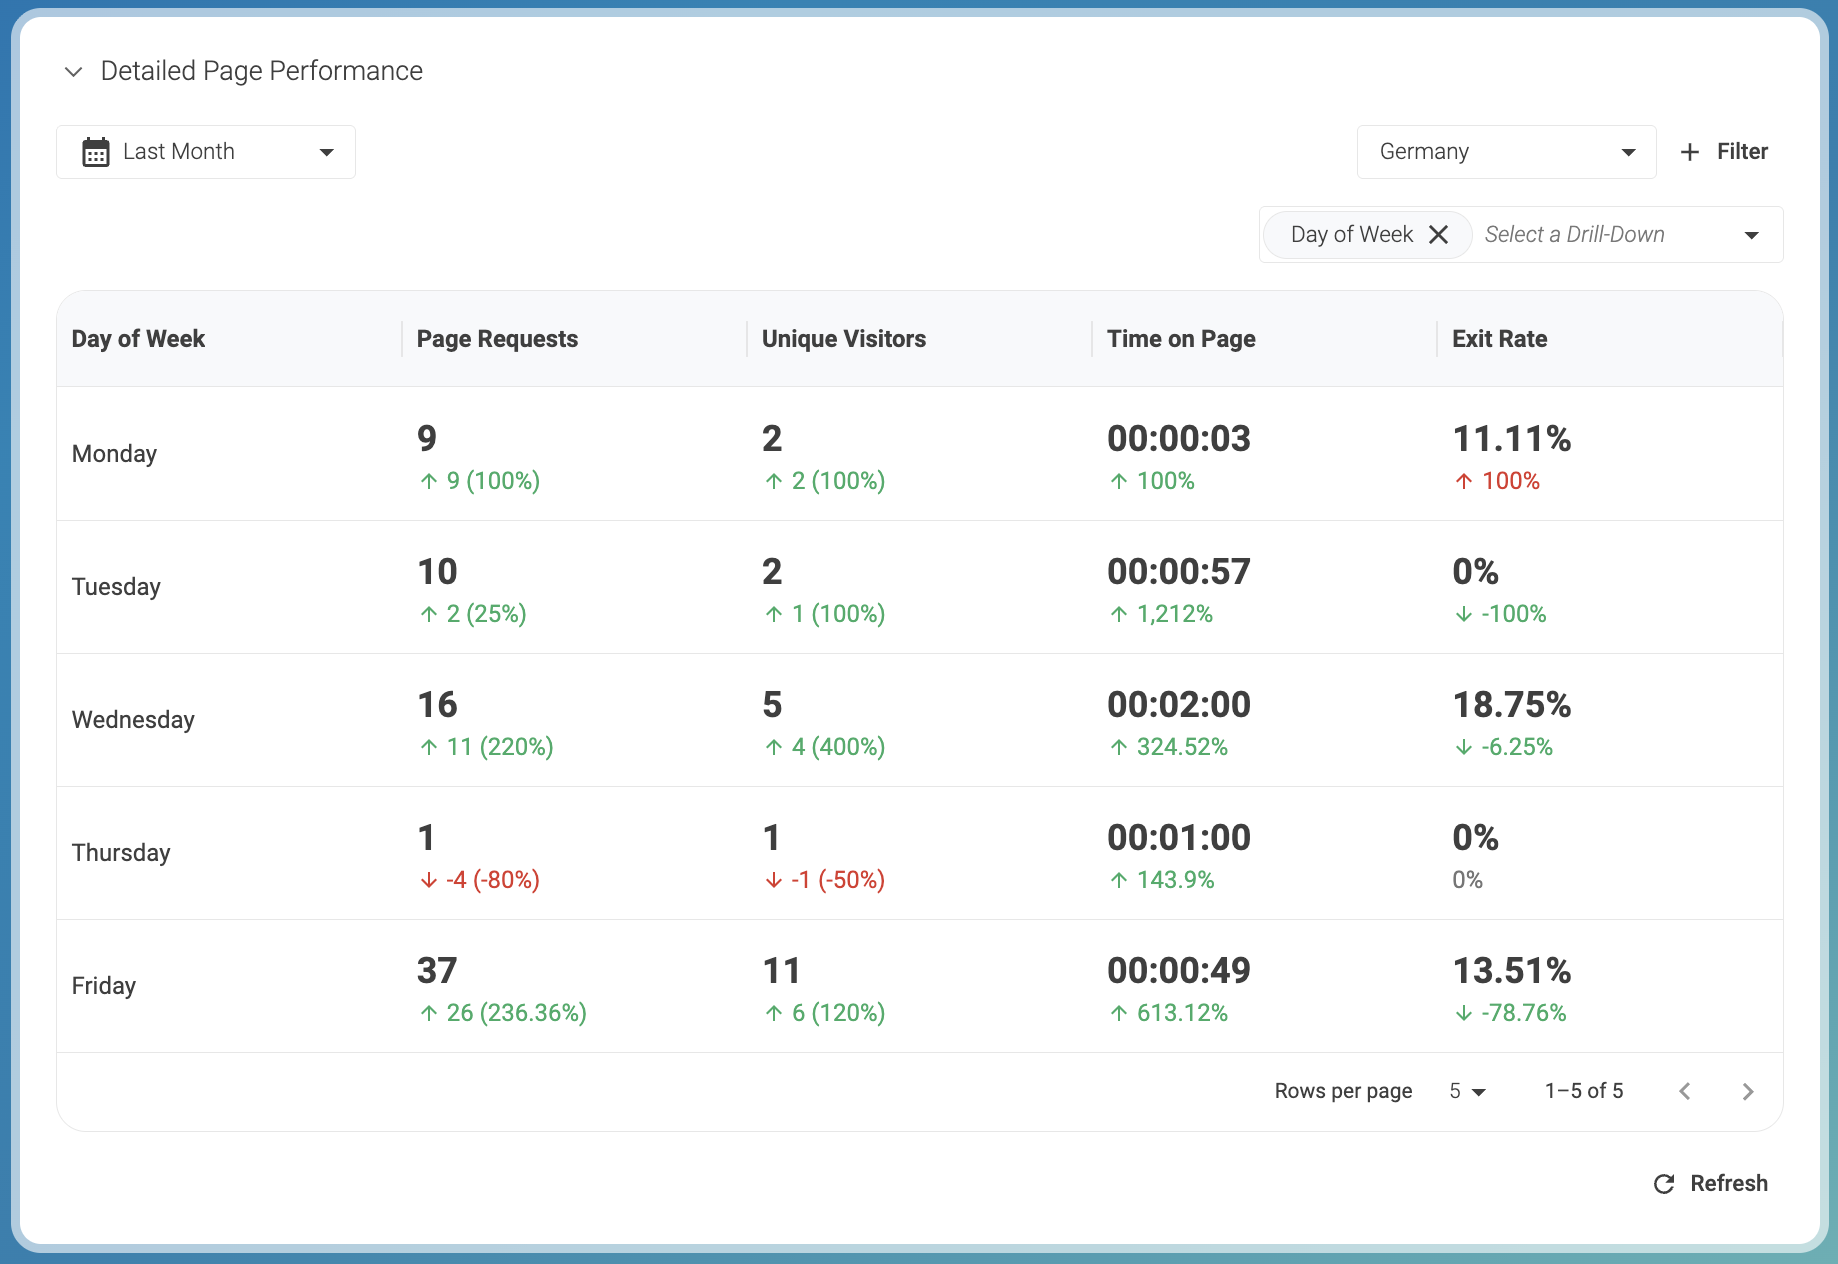
Result
After you select Day of the Week the Detailed Page Performance
table shows data for visitors from Germany during last month.
Each row in the table aggregates data for a weekday. For example, the table shows that visitors prefer Fridays to access the page.