


Solution Overview for Business Users / Version 2512.0
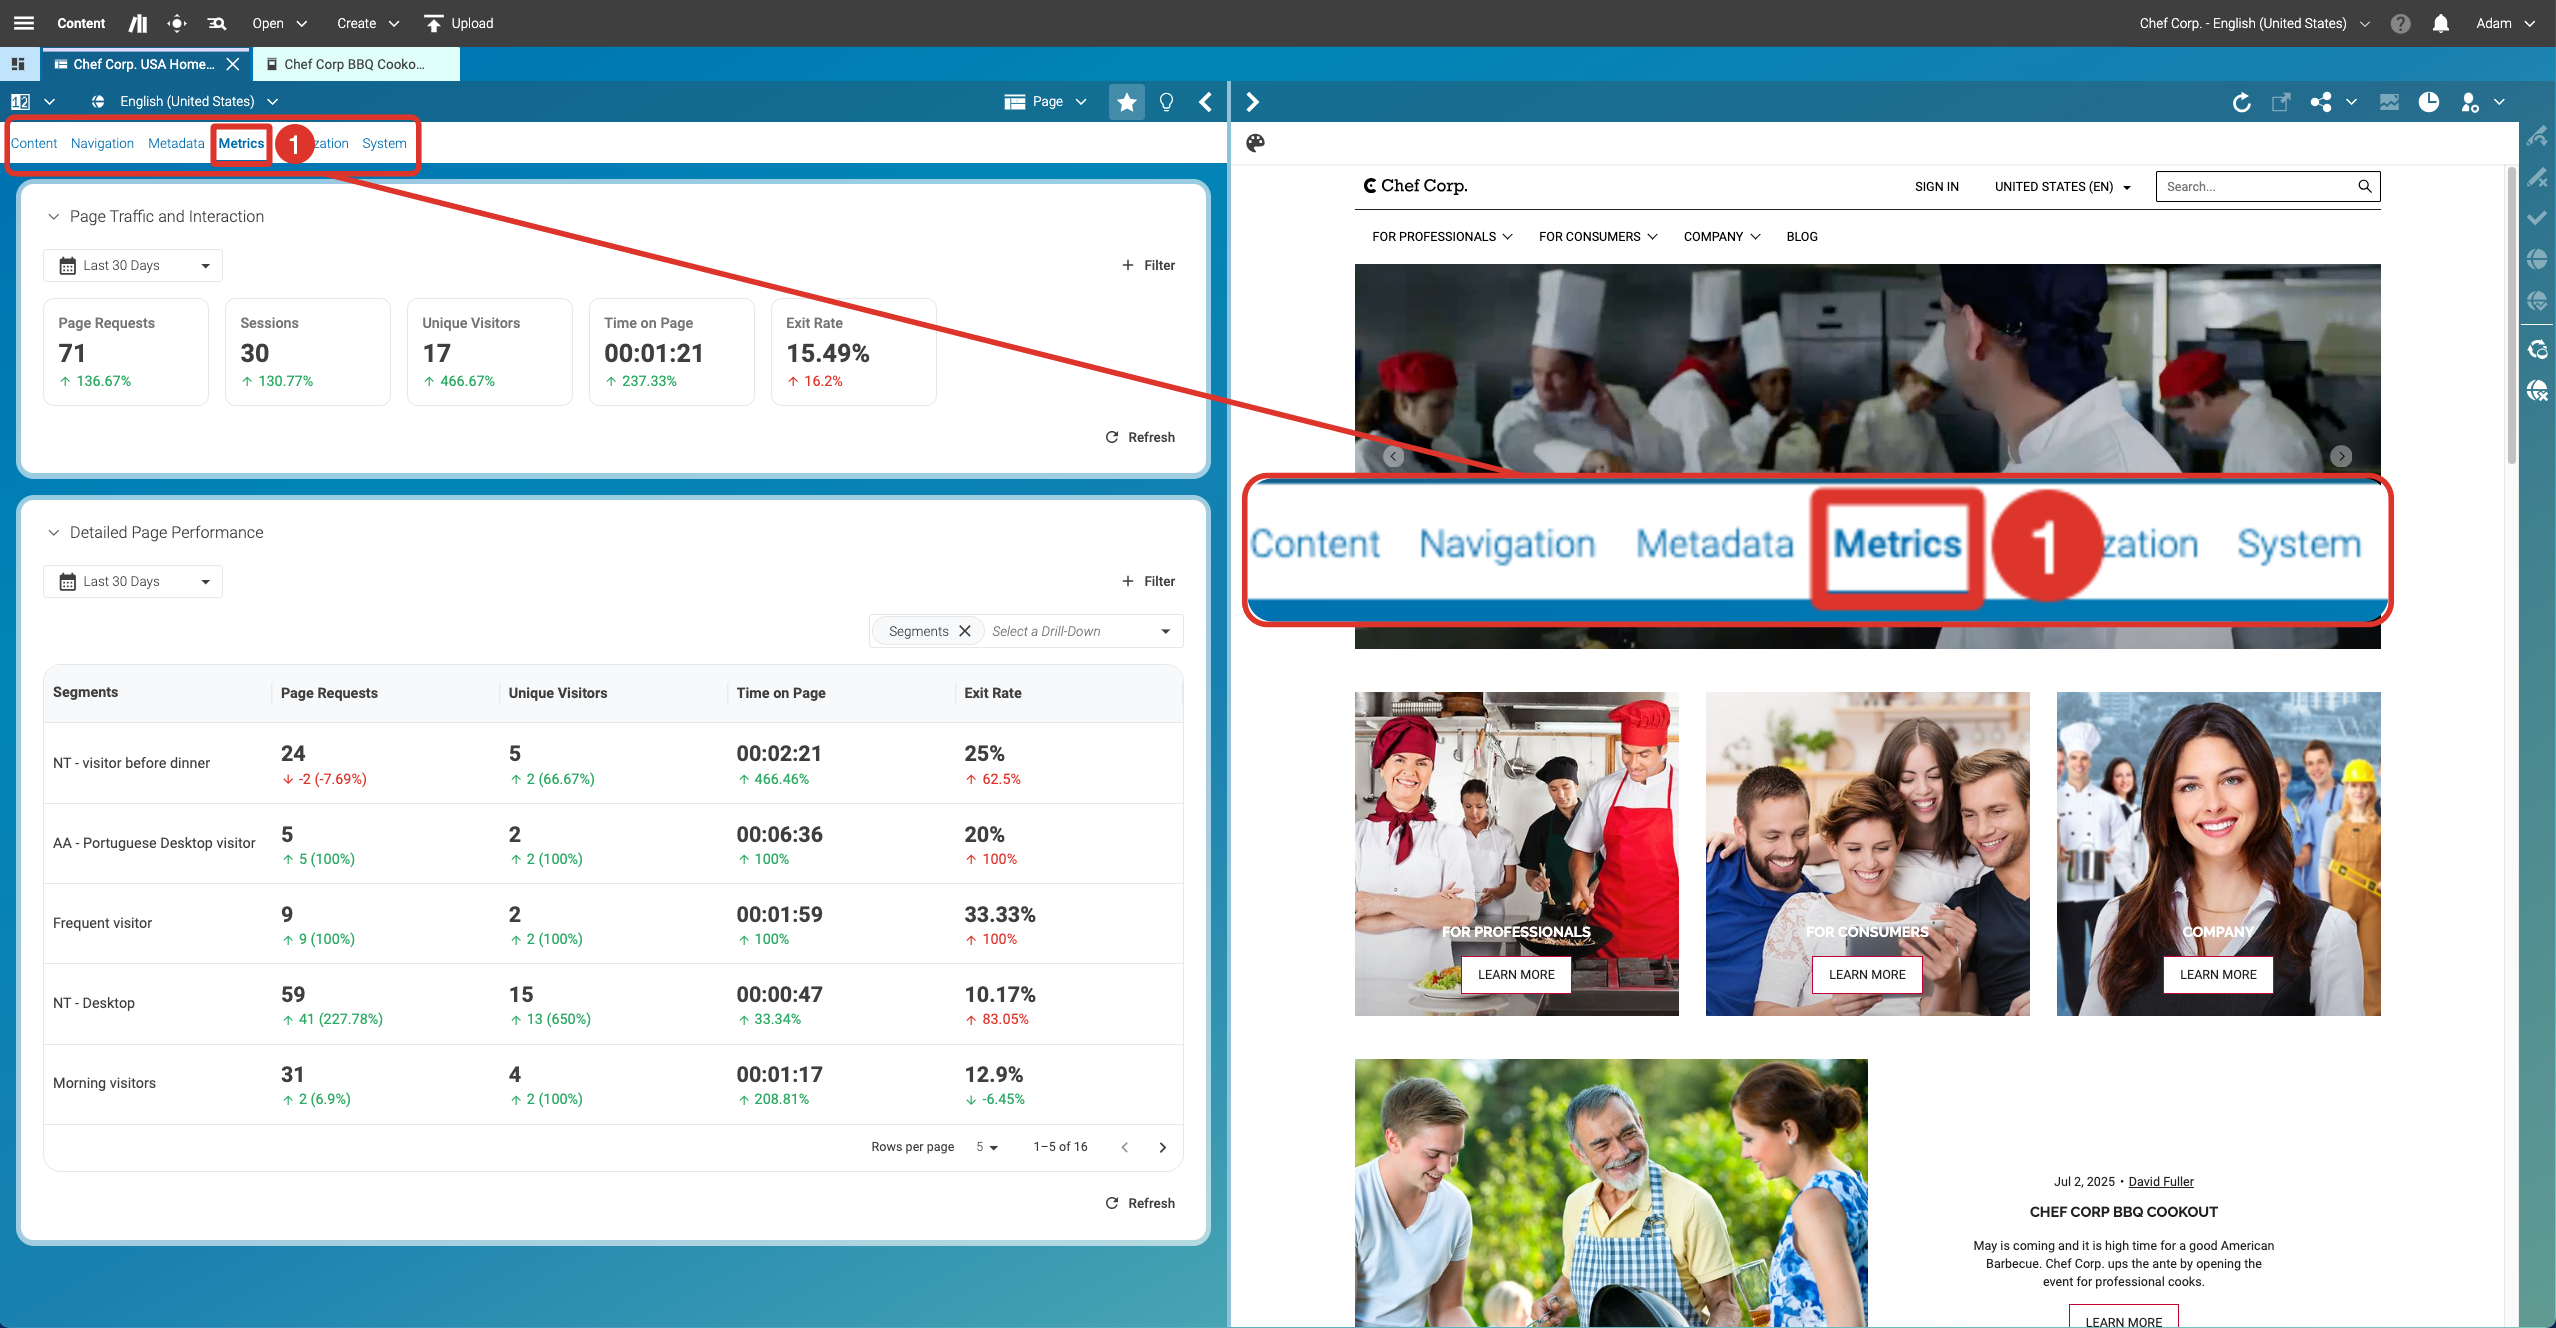
Table Of ContentsWhen you are in Content Studio, open an Article or a Page. The Metrics tab (1) is next to Metadata. If you see a three-dots-menu, hover over it, and the other tabs, including Metrics, will appear, and you can open it.
Understanding Performance Data
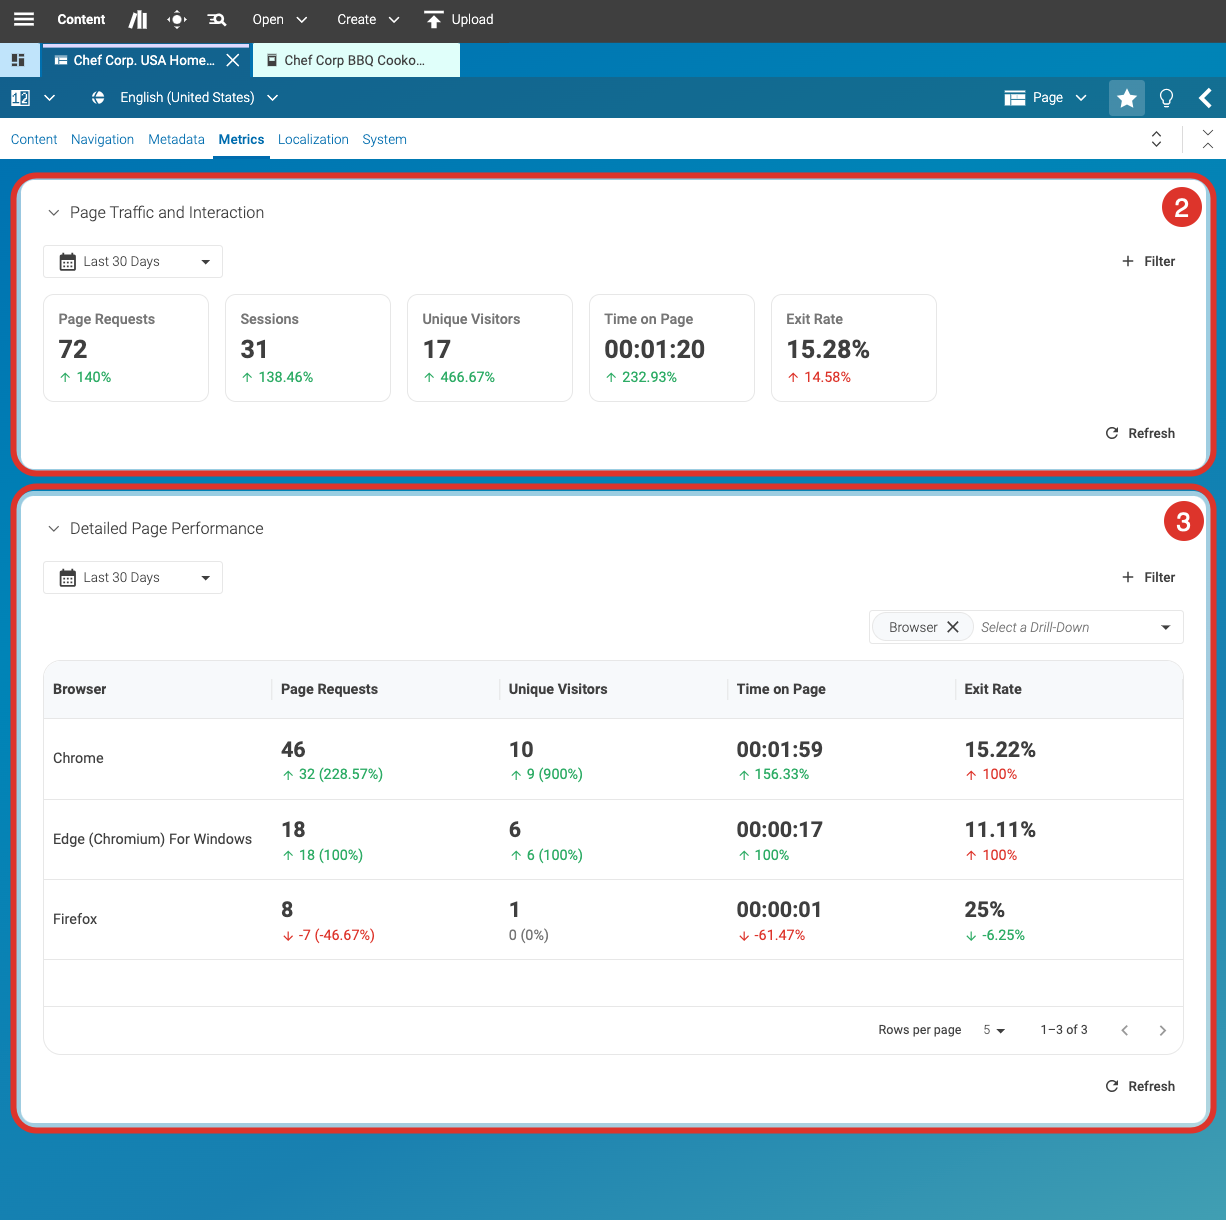
When first accessing the Metrics tab, you will see two boxes. Page Traffic and Interaction (2) is a summary of Detailed Page Performance (3). The difference between the two boxes is that the view at the top (1) provides you with quick info at a glance. The bottom box (3) allows you to further differentiate the data by selecting your approach to group the data (as described in the next step).
Using Filters and Selecting a Drill-Down
Next, narrow your focus by selecting specific filters and drill-down options.
As you saw in the screenshot from step 2, Segments was selected as a Drill-Down. Here are a few things that are good to know before you start using the different filters and drill-down options:
By default, Segments is the selected Drill-Down option. You can always change it — see step 3.
On this level, you can only have one Drill-Down option. The selected option is displayed in a table, and having more than one at a time could make the table confusing or overwhelming.
Select a different segment
You can switch between segments to compare behaviors and results instantly.
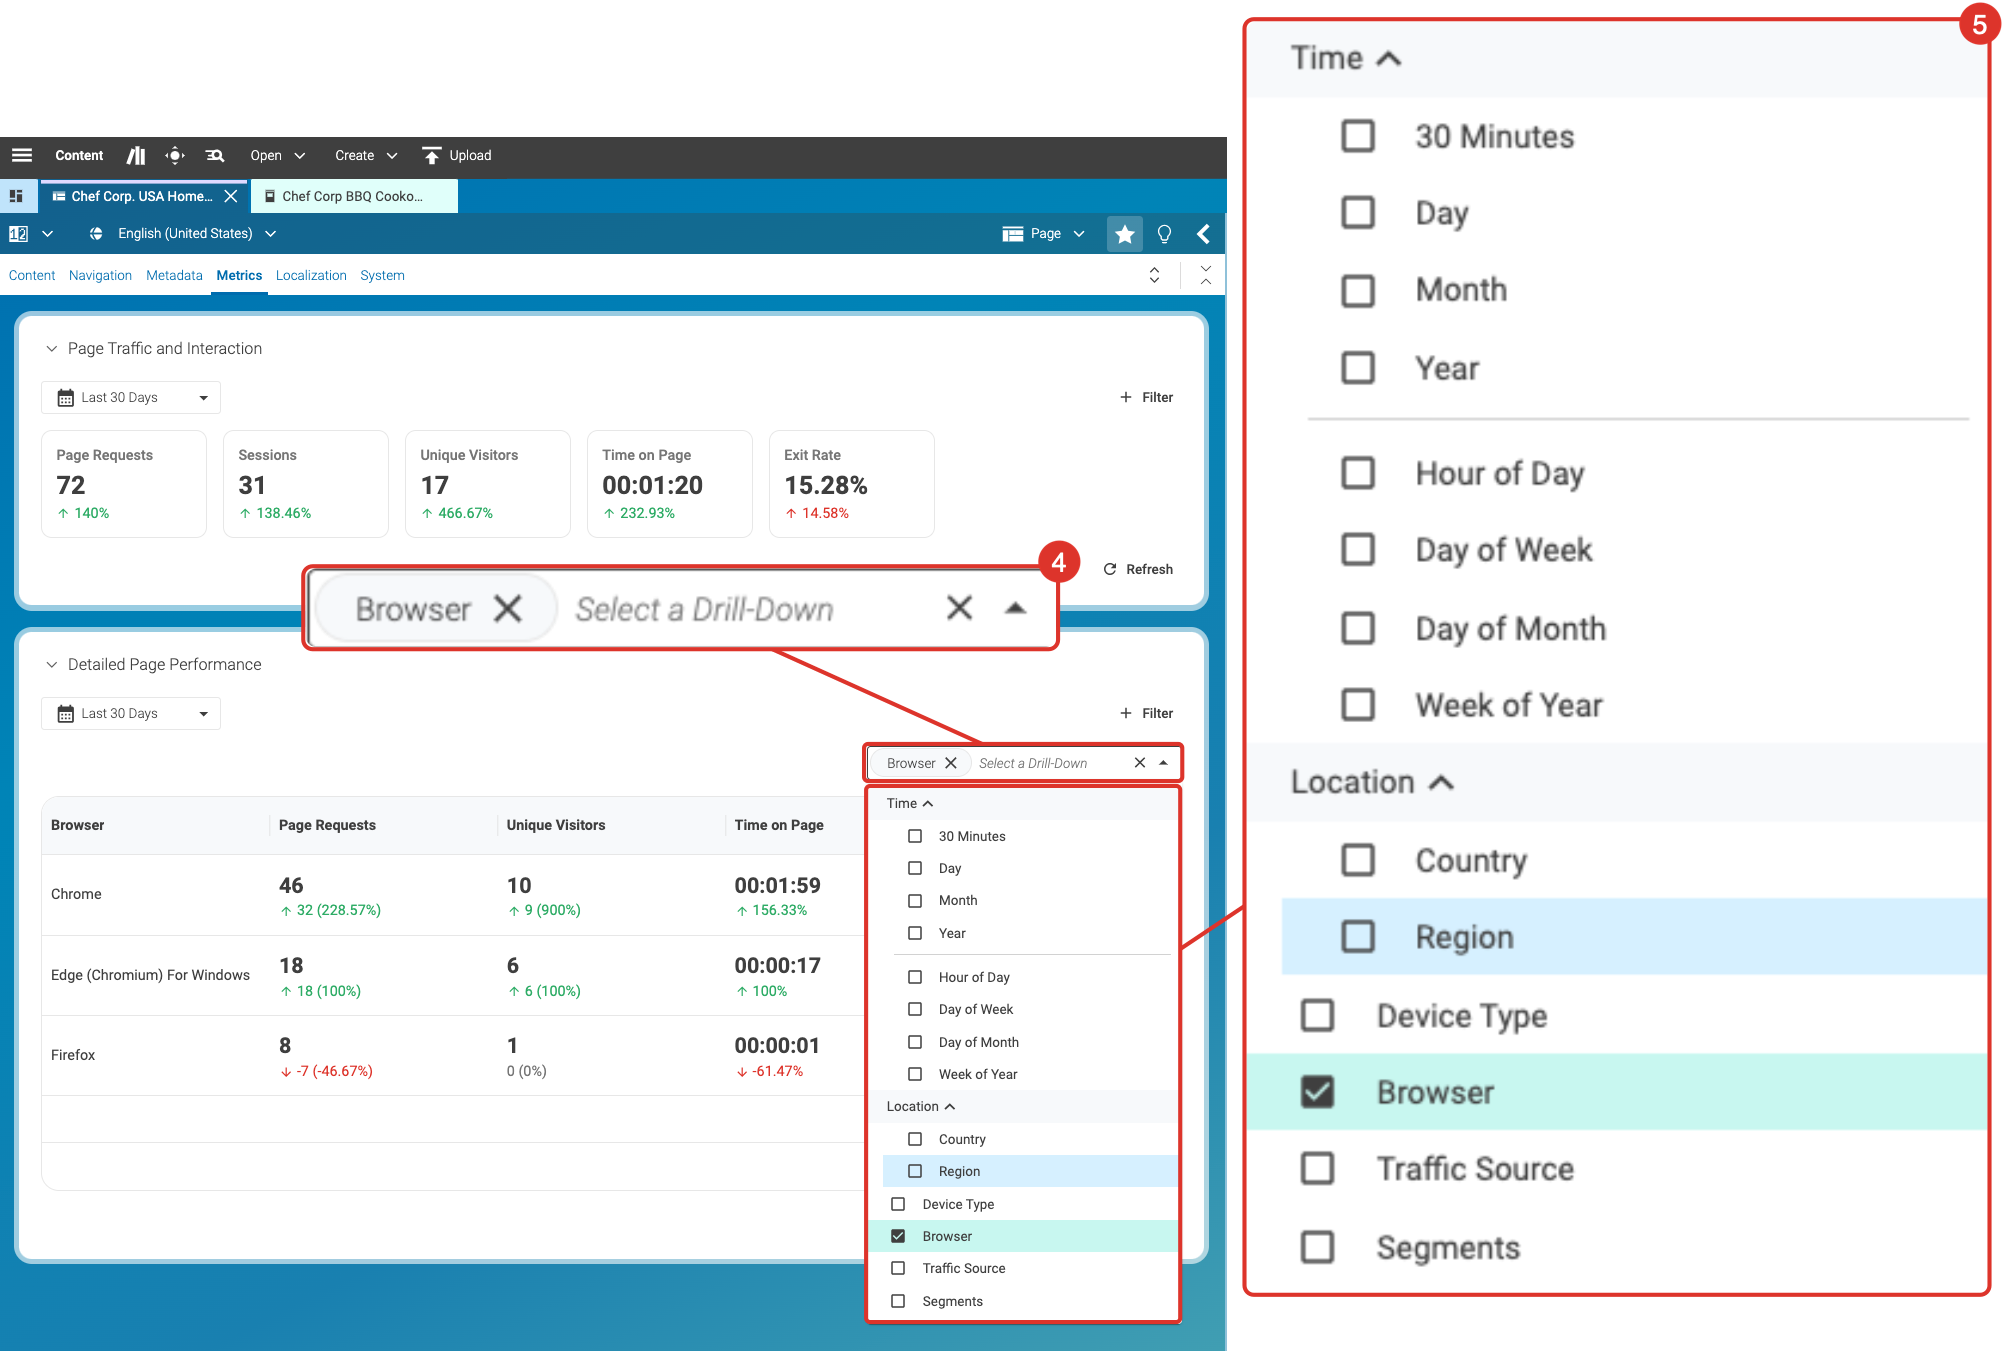
First, click into the field that says Select a Drill-Down (4). Here you can directly deselect the current option, either by clicking on the small X-symbol or by selecting something different. In this example, Browser was selected.
Either way, by clicking into the field (4) you open the menu (5) and then you see all the options you have for filtering.
Drill-Down Options and Examples
As you could already see in the previous picture with the opened menu, you can check the performance of your content item in multiple ways. ➡ Remember: on page level, not site level.
You want to see the page performance data for each day of the week to check for variations based on the weekday.
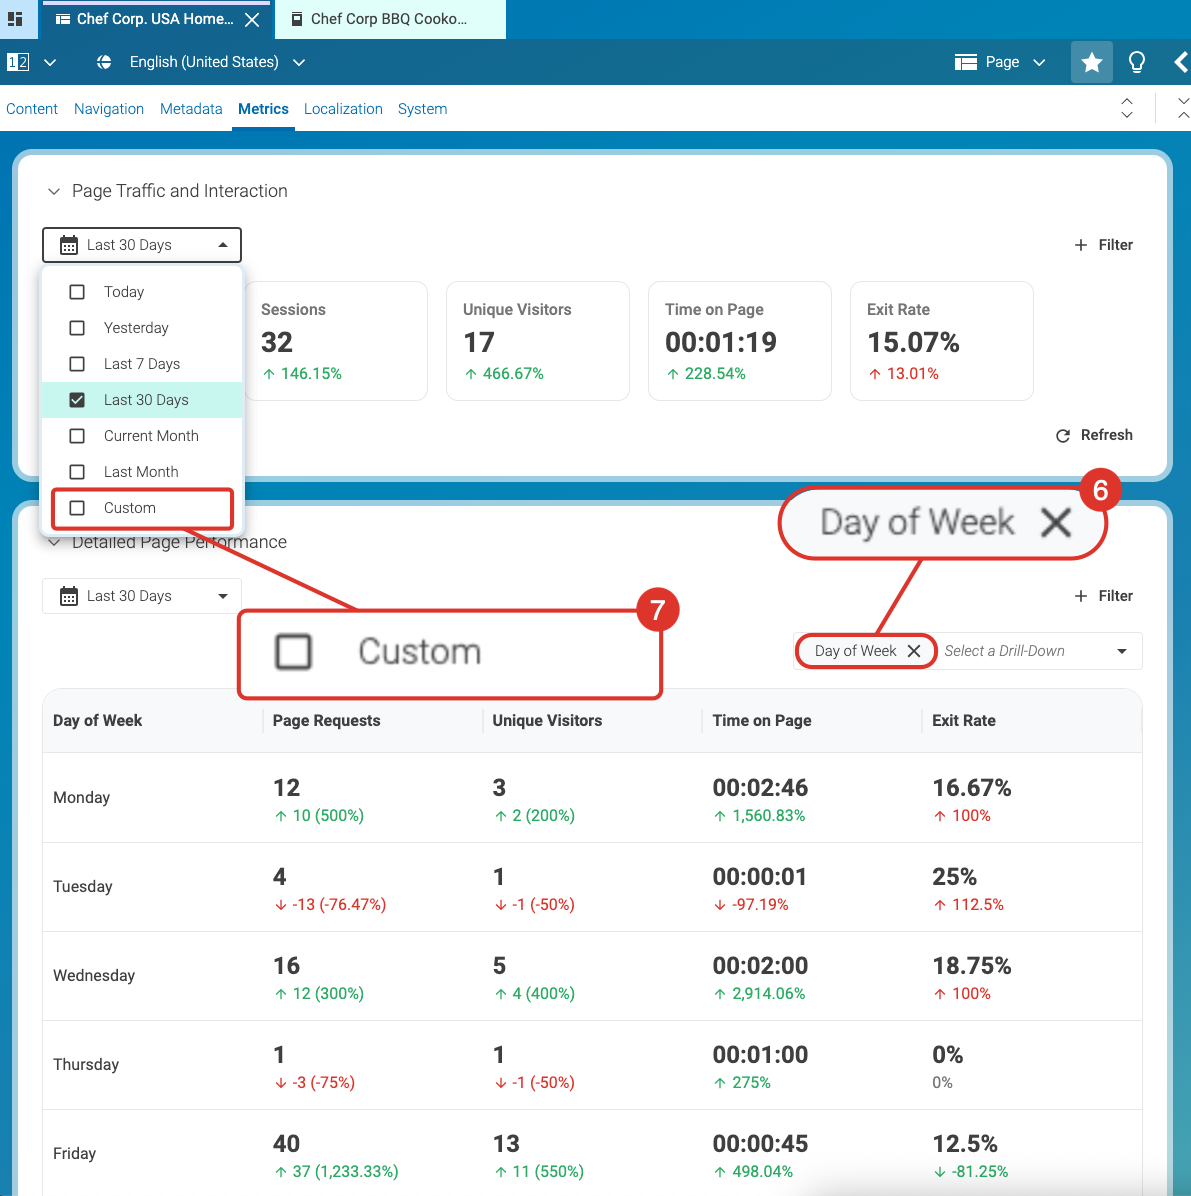
In the bottom box (Detailed Page Performance), select the Drill-Down option Day of Week (6).
To adjust the time range, go to the top box (Page Traffic and Interaction):
Choose one of the quick options: Today, Yesterday, Last 7 Days, Last 30 Days, Current Month, or Last Month.
➡ Need a specific time range? Select Custom (7).
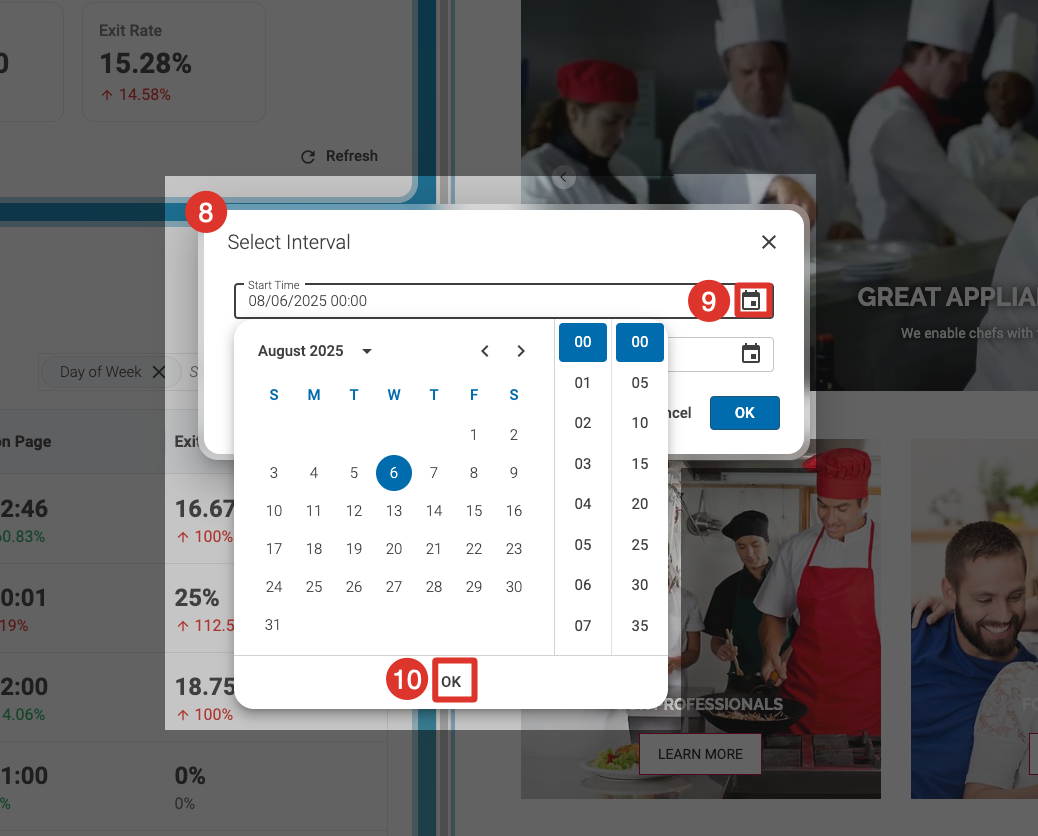
Once you've selected Custom from the menu, the dialog box Select Interval (8) opens. You can go back as many days, weeks, or months as you'd like.
Set the Start Time (9) and End Time and confirm with OK (10).
To get you started, you could try out this or a similar example, and play around with the data for a while. You will notice quickly that it is very intuitive and full of capabilities!
