Studio Developer Manual / Version 2310
Table Of ContentsAll modern browsers provide tools for web application debugging. These are usually simply called "Developer Tools" and can be invoked via a menu entry, a toolbar button, the F12 key or the key combination Ctrl+Shift+I.

Note
While in the past CoreMedia did recommend to use Google Chrome, as of today, both Chrome and Firefox are very powerful for debugging. Just use the one you prefer. The documentation will feature descriptions for using the Google Chrome debugger.
All modern browser developer tools provide tabs for different tools:
DOM Explorer / Element / Inspector — Inspect the page's actual DOM elements as a DOM tree, with the option to select an element on the rendered page to reveal it in the tree. Selected DOM tree nodes are highlighted on the rendered page. The DOM can be watched for changes and modified interactively.
Console — All JavaScript messages and errors are logged to this console, and it provides a read-eval-loop for JavaScript expressions.
Network — Inspect all HTTP network traffic between the client-side application and the server, static resources as well as Ajax (XHR) requests. Most developer tools offer to disable the cache while they are active, to make sure that you always load the most recent version of code and other resources you just changed.
Debugger / Sources — Inspect all loaded JavaScript and CSS sources, set breakpoints to debug in step by step mode. Most modern developer tools allow you to change sources interactively with immediate effect.
Profiles / Profiler / Audits / Memory / Analysis — Diverse tools to measure your web application's client-side and network performance and memory usage. Helpful to find memory leaks (see below) and track performance issues.
All browser developer tools offer a convenient way to navigate to a certain script file or
Ext JS class: With the Sources / Debugger tab active, press Ctrl-P (note that this
invokes the print dialog when the focus is not on the developer tools!) and just start typing the name of
the class (file) you want to debug, and the list is filtered incrementally.
Some tools even support typing camel case prefixes of the class name, for example to find
the class PreviewPanelToolbarBase in Google Chrome, press Ctrl-P and
type "PrevPaToBa" to quickly reduce the number of suggestions.
To navigate to the desired line in the file, you can add a colon (:) and the line number directly after the file search term. To jump to a certain column in the line append another colon (:) followed by the column number. To navigate to (a column in) a different line, press Ctrl-L or Ctrl-G (Goto Line) and enter the line number (and a colon with column number).
A very efficient way to locate a certain line of a file in Google Chrome's Developer Tools (to set a breakpoint, for instance) when working with IntelliJ IDEA is as follows. In IDEA, jump to the very start of the line (press Pos 1 repeatedly until there). Then, press Ctrl-Alt-Shift-C ("Copy Reference"). IDEA's status line shows a message that the file/line reference has been copied to the clipboard. Switch to Chrome Developer Tool's Sources tab (Alt-Tab suffices when changing back and forth) and press Ctrl-P. Now paste the file/line reference and remove the file extension (also see section about source maps). Hitting Return, Chrome accepts the syntax file-path:line and takes you to the exact file and line.
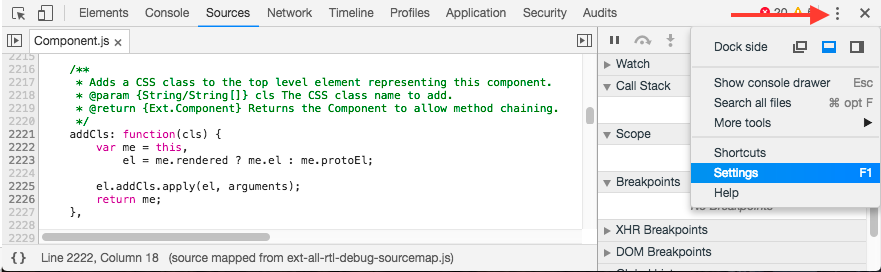
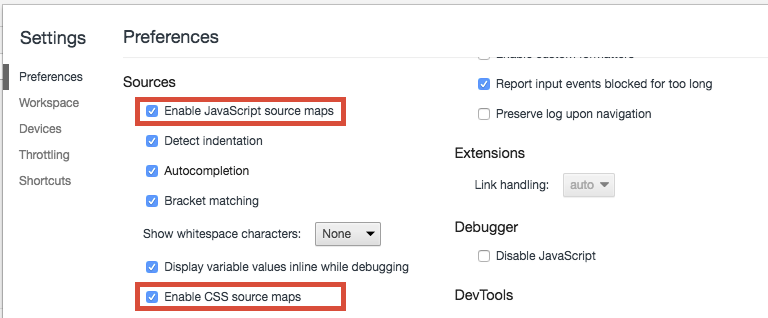
Opening a CoreMedia Studio file in the debugger requires the source maps feature to be enabled in the developer tools settings. This is the default in Google Chrome. If not enabled, a file lookup with Ctrl-P will fail. To enable source maps in Google Chrome open the Developer Tools settings by pressing the F1 key or by selecting in the control menu, see Figure 8.1, “Open Chrome Developer Tools settings”.
Then enable the checkboxes marked red.
Note
While the lines of plain TypeScript source files will match the lines of the files your see in the browser this is not the case for classes compiled to Ext JS. The former will be shown as TypeScript files in the browser while the latter will be shown as JavaScript files.
The reason for this difference is the transformation that both of these source files undergo when being compiled. While plain TypeScript source files will basically keep their structure when being transformed to JavaScript, all TypeScript files transformed to Ext JS will receive major structural changes so that using the TypeScript source files would debugging does not properly work. This is why you will see them as (non-minified) JavaScript files in the browser that are already transformed to Ext JS.
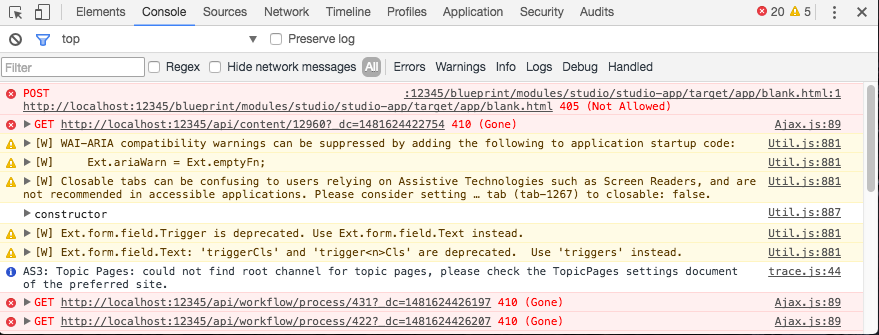
The debugger allows you to set breakpoints, to automatically pause on errors, to step through the script at runtime and to evaluate expressions in the current scope of the script. In this context, the Console tab, see Figure 8.3, “Google Chrome Console”, is also very helpful, because it offers a JavaScript shell for direct interaction with the current script. The console displays the results of the expressions evaluated in the shell and also messages generated by the current script runtime. In Google Chrome you can also open and close the console in the Sources tab by pressing the escape key.